
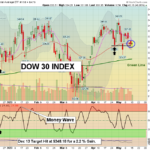
Markets were slightly higher today, but the Volume was low again. Most of the Leaders are coming down from the Red Zones (probably too late to Buy for the short term) for Buy Signals soon. The FAANG Stocks (mainly AAPL GOOGL META & MSFT) are … [Read more...]
Money Wave Alert! May 15, 2023
Money Wave Alert! May 12, 2023
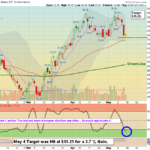
Markets were lower again today, but the NASDAQ 100 Big Tech was still able to make a higher high. Volume was low again, as most of the Leaders were up in the Red Zones (probably too late to Buy for the short term). The FAANG Stocks (mainly AAPL GOOGL … [Read more...]
Money Wave Alert! May 11, 2023
Markets were slightly lower today, but the NASDAQ 100 Big Tech was able to make a higher high. Volume was low again, as most of the Leaders are up in the Red Zones (probably too late to Buy for the short term). The FAANG Stocks (mainly AAPL GOOGL … [Read more...]
Money Wave Alert! May 10, 2023
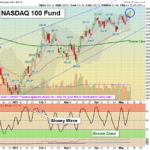
Markets were mostly higher today as the CPI Inflation number came in lower than expected. Volume was low again, but the NASDAQ 100 Fund was able to make a higher high. The FAANG Stocks (mainly AAPL GOOGL META & MSFT) are being bought for a … [Read more...]
Money Wave Alert! May 9, 2023
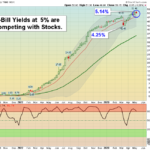
Markets were mixed again today on very low trading Volume. The Volume on the S&P 500 Fund just before the Close was only 1/3 of normal Volume. Investors can't decide to Buy or Sell, but that will eventually change. We are happy with a Money Fund … [Read more...]
- « Previous Page
- 1
- …
- 148
- 149
- 150
- 151
- 152
- …
- 491
- Next Page »