
Swing trading sits between day trading and long-term investing, aiming to capture price moves that unfold over several days to several weeks. Because the holding period is short enough to be sensitive to momentum but long enough to smooth out intraday noise, the indicators used in swing trading must balance trend recognition, momentum confirmation, and risk control. No single indicator is sufficient on its own; the most effective swing traders combine a small set of complementary tools rather than stacking dozens of signals that often contradict each other.
One of the most foundational tools is the Moving Average, particularly the 20-day, 50-day, and 200-day Simple Moving Averages (SMAs). Moving averages help traders quickly determine the prevailing trend and identify potential support or resistance zones. When price is consistently above a rising moving average, the market is generally in an uptrend; when below a declining average, the trend is typically down. Crossovers—such as the 20-day moving above the 50-day—can signal strengthening momentum, while pullbacks toward a rising average often present structured entry opportunities. For swing traders, moving averages act less as prediction tools and more as trend filters that keep trades aligned with broader market direction.
Another essential category is Momentum Indicators, with the Relative Strength Index (RSI) being one of the most widely used. RSI measures the speed and magnitude of price changes on a scale from 0 to 100, helping traders identify overbought and oversold conditions. While extreme readings do not automatically signal reversals, they can highlight areas where price may pause or consolidate. In swing trading, RSI is most effective when used in conjunction with trend direction—for example, looking for RSI pullbacks to the 40–50 range during an uptrend rather than relying solely on the traditional 30/70 thresholds.
Volume-based indicators add a crucial layer of confirmation. Relative Volume and On-Balance Volume (OBV) help traders understand whether price movements are supported by meaningful participation or merely drifting on low activity. A breakout accompanied by strong volume suggests institutional interest and increases the probability that the move will continue. Conversely, price advances on declining volume may indicate weakening conviction. Swing traders often watch for volume surges at key technical levels such as trendline breaks or resistance zones, using volume as a validation tool rather than a standalone signal.
Support and Resistance analysis—while not always labeled as an “indicator”—is equally important. Horizontal price levels, trendlines, and previous highs or lows frequently act as decision points where buyers and sellers reassess value. Indicators such as Bollinger Bands or Average True Range (ATR) can help quantify volatility around these levels, assisting traders in setting realistic profit targets and stop-loss placements. ATR, in particular, is useful for position sizing and risk management because it reflects how much a stock typically moves in a given period.
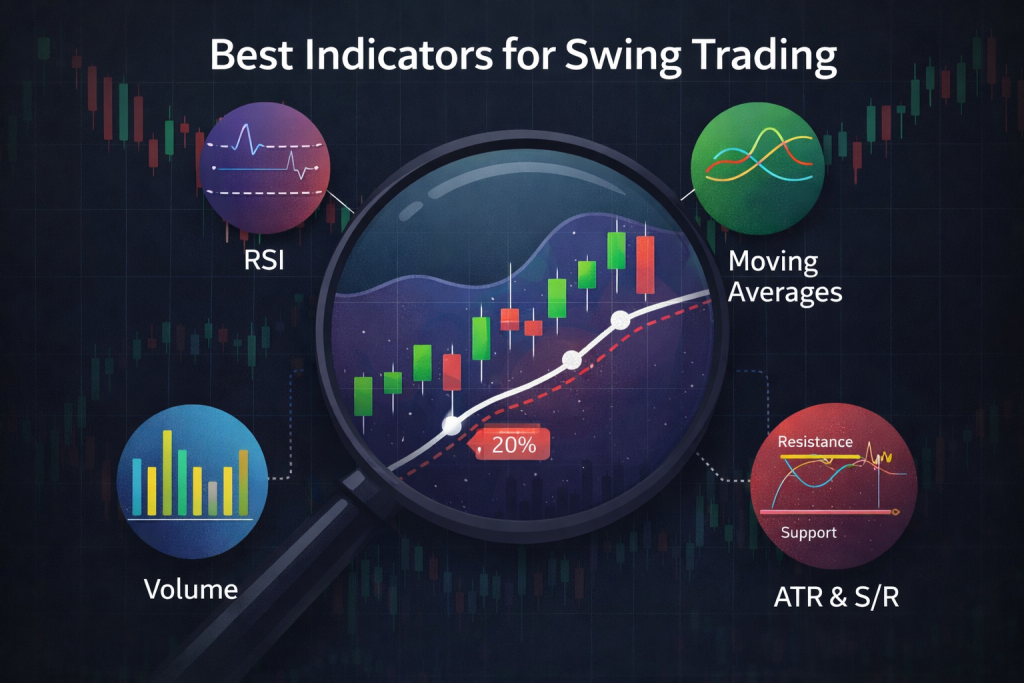
Ultimately, the best indicators for swing trading are those that work together rather than compete. A practical combination might include a moving average for trend direction, RSI for momentum timing, volume for confirmation, and ATR for risk control. The objective is not to predict every move, but to create a structured decision framework that improves probability and consistency. Successful swing trading is less about finding a perfect indicator and more about applying a small, reliable toolkit with discipline and repeatability.
