Oct 12, 2025.
The Top Pick of the Week System is up +75 %, vs the S&P 500 up +17,5% (since the Oct. 7, 2024 inception).
For busy investors that don’t have time to Swing Trade, we now have a simple Strategy:
Top Pick of the Week. You Buy the “Pick” on Monday morning, and then Sell on Friday’s Close. It’s a time-efficient approach designed to capture short-term gains without requiring constant market monitoring.
This “Pick” is emailed to you with this Weekly Commentary (see below & more details here).
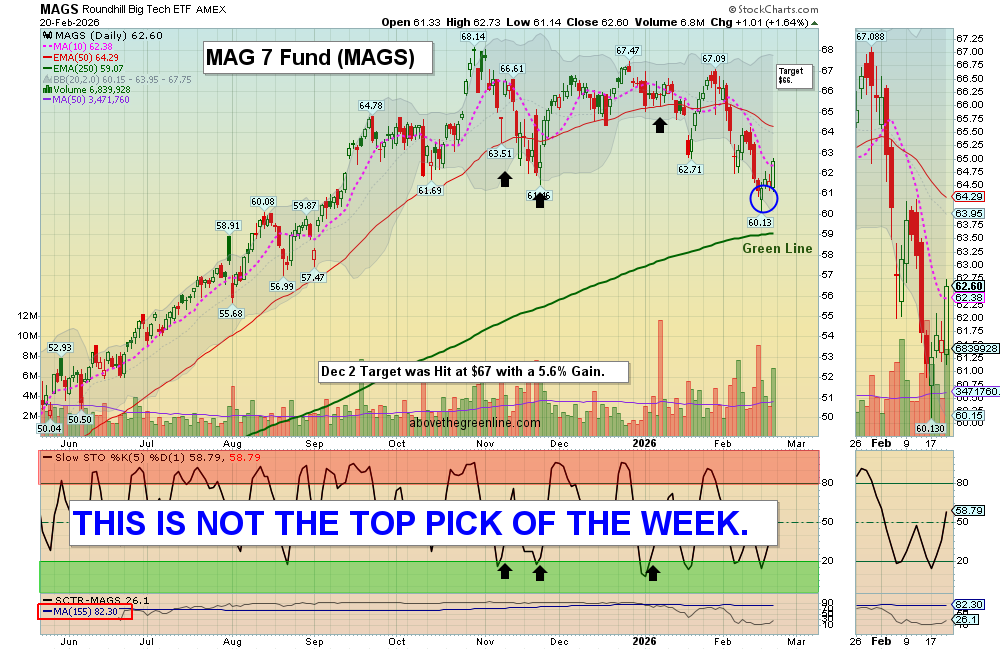
The Top Pick of the Week is: Magnificent 7 Fund $MAGS to be bought on the Open on Monday, and will be sold on the Close on Friday.
You can view the current Weekly Stock Performance.
______________________________________________________________________________
DAILY SWING TRADING (SHORT TERM)Watch List and Charts to Buy Soon.
| Daily Swing Watch List to Buy | Daily Swing Charts to Buy |
| Current Daily Swing Positions | Current Swing Charts |
| Closed Daily Swing Results | Trading Dashboard |
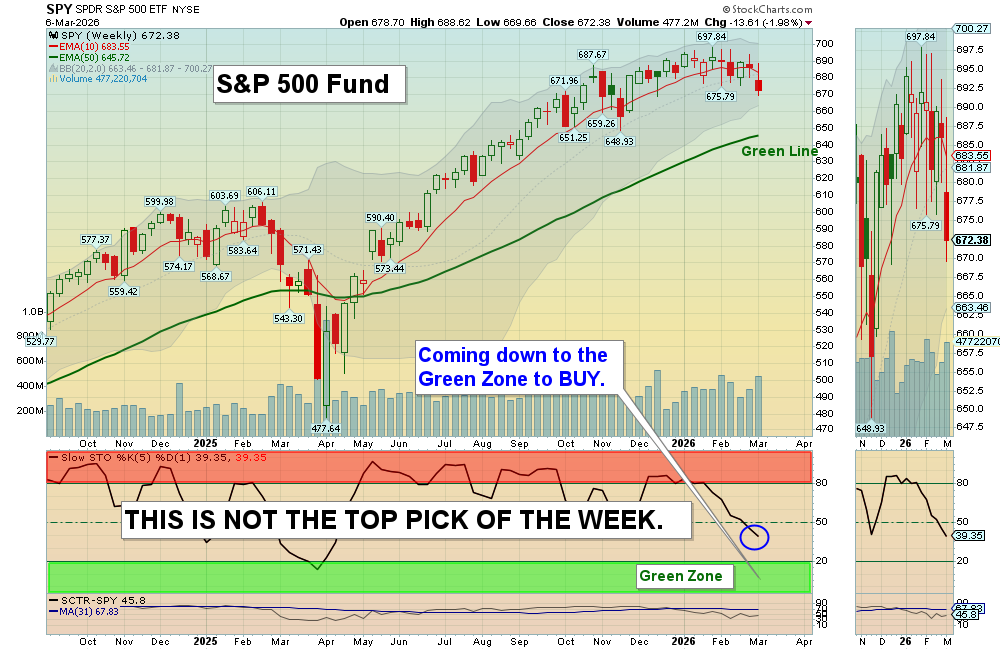
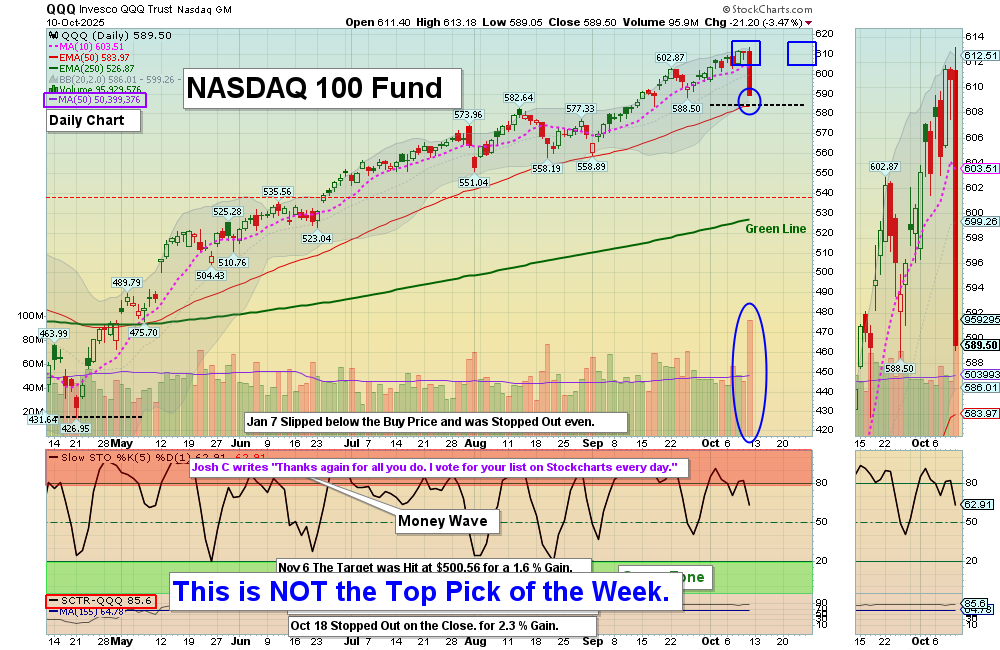
10/12/2025 Markets were sharply lower for the week as the Stock Indices slipped below the Pink Lines (10-day avgs,) to create short term Sell Signals. The Markets appear to be in a Wave 4 correction down to the 50-day averages or lower, than back up once more. Try to Buy investments that are still above the Red Lines (50-day avgs.)
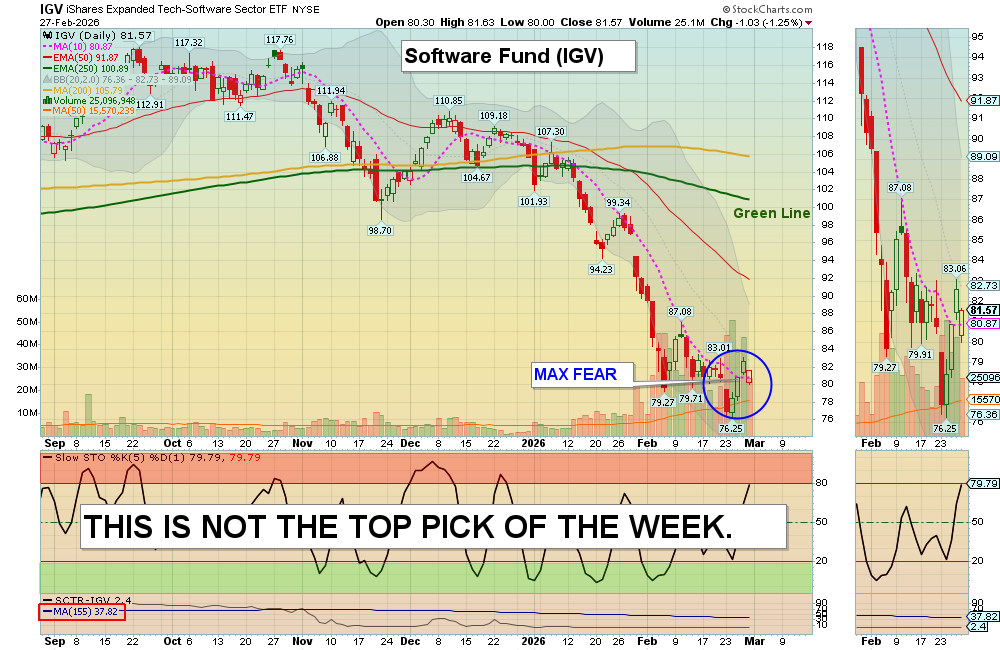
The Strongest Leaders are coming down from being very overbought after the April Fear Flush dump. Wait for more Green Zone Buy Signals soon.
We Buy the strongest Leaders that make new highs, on pull-backs. So follow the Green Line System and you should continue to win more than you lose. SEE WATCH LIST
With the Green Line System, your Money should flow into the Strongest areas and your Account value should be able to grow in both Bull and Bear Markets. Follow the MONEY, not the MEDIA.
______________________________________________________________________________
For the week the Dow was down 2.70%, the S&P 500 was down 2.42% and the NASDAQ 100 was down 2.27%. The major Indices still have a Relative Strength below 80, so you should currently own the stronger Funds here.
The Inflation Index (CRB) was down 2.20% this week and is Below the Green Line, indicating Economic Contraction.
Bonds were up 1.39% for the week, and are Above the Green Line, indicating Economic Contraction.
The US DOLLAR was up 1.146% for the week.
Crude Oil was down 4.34% for the week at $58.24 and GOLD was up 3.32% at $4015.59, a new high.
_______________________________________________________________________
DAY TRADERS: We are doing many profitable Day Trades at our Live Trading Room on YouTube during Market hours. Please join Discord or X (Twitter) with your cell phone app for the fastest Trade Alerts and Daily email notifications during the day. Other methods of notification have been too slow.
_______________________________________________________________________
SWING TRADE COMPLETED TRADES:
ALAB Astera Labs Sold via Alert at $223 for a 14.65 % Gain.
CLS Celestica Inc. Target was Hit at $256 with a 0.44% Gain .
MP MP Materials Target was Hit at $76 with a 6.29% Gain.
SOFI Target was Hit at $28.25 with a 7.17% Gain.
We are now in 1 Three Star logged Swing Trading Position for the Short Term. There are 3 investments on the Short Term Watch List.
Completed Swing Trades thru Sep 2025: 184 Trades, + 556% Total. Avg. Trade = 3.02 % Gain (before taxes and commissions).
______________________________________________________________________________
WEEKLY SWING TRADES – WATCH LIST
| Open Date | Symbol | Description | Industry | SCTR | Size | Last Price | Daily Change % | ATGL 60 Min | Comments | id | Strategy | Position | Sell Date | Sell Price | Purchase Price | Net Profit | Realized Gain/Loss % | ATGL Rule | Stop Loss | color | Chart | Update Date | Status | Unrealized Gain/Loss % | Volume | Post Type | # Shares | Amount Invested | Portfolio Weight | Dividend Rate | Current Yield | Current Value | Yield on Cost | Projected Annual Dividends | Total Dividends Received | Pay Back | Profit / Loss | Annualized Profit/Loss | Star Rating | Target Price | News Alert % | Target Triggered |
|---|---|---|---|---|---|---|---|---|---|---|---|---|---|---|---|---|---|---|---|---|---|---|---|---|---|---|---|---|---|---|---|---|---|---|---|---|---|---|---|---|---|---|
| 2026-07-08 | BW | Babcock & Wilcox | Financial | 96 | Small | $10.95 | 0.183 | Wait for next Weekly Money Wave Close > 20 with High Volume. | 5123 | Long Term | Long | $0.00 | 0.00% | https://stockcharts.com/sc3/ui/?s=BW&a=2308001998&p=W&yr=1&mn=0&dy=0&id=p84859429849 | 2026-07-08 18:53:47 | open | 0.00% | 262556 | Watch List | $0 | 0.00% | 0.00 | 0 | $0 | 0.00% | $0 | $0 | 0.00% | 0.00% | - | $17.00 | |||||||||||
| 2026-07-01 | NVTS | Navaitas Semi. | Semiconductor | 80 | Mid | $12.96 | 0.6605 | Wait for next Weekly Money Wave Close > 20 with High Volume. | 5114 | Long Term | Long | $0.00 | 0.00% | https://stockcharts.com/sc3/ui/?s=NVTS&a=2304700575&p=W&yr=1&mn=0&dy=0&id=p49574092537 | 2026-07-02 22:12:37 | open | 0.00% | 2307291 | Watch List | $0 | 0.00% | 0.00 | 0 | $0 | 0.00% | $0 | $0 | 0.00% | 0.00% | - | $24.00 | |||||||||||
| 2026-06-30 | NOK | Nokia Corp. | Telecom | 92 | Large | $11.68 | -0.0855 | Wait for next Weekly Money Wave Close > 20 with High Volume. | 5108 | Long Term | Long | $0.00 | 0.00% | https://stockcharts.com/sc3/ui/?s=NOK&a=2302004445&p=W&yr=1&mn=0&dy=0&id=p52583455345 | 2026-06-30 16:54:43 | open | 0.00% | 17477515 | Watch List | $0 | 0.00% | 0.16 | 1.3798 | $0 | 0.00% | $0 | $0 | 0.00% | 0.00% | - | $16.00 | |||||||||||
| 2026-06-29 | AAOI | Applied Opto | Telecom | 95 | Small | $119.34 | 6.6679 | Wait for next Weekly Money Wave Close > 20 with High Volume. | 5104 | Long Term | Long | $0.00 | 0.00% | https://stockcharts.com/sc3/ui/?s=AAOI&a=2300865339&p=W&yr=1&mn=6&dy=0&id=p68280620441 | 2026-07-05 19:24:45 | open | 0.00% | 2530338 | Watch List | $0 | 0.00% | 0.00 | 0 | $0 | 0.00% | $0 | $0 | 0.00% | 0.00% | - | $180.00 | |||||||||||
| 2026-06-26 | AA | Alcoa Corp. | Metals | 89 | Mid | $49.45 | 1.4984 | Wait for next Weekly Money Wave Close > 20 with High Volume. | 5101 | Long Term | Long | $0.00 | 0.00% | https://stockcharts.com/sc3/ui/?s=AA&a=2299172341&p=W&yr=1&mn=6&dy=0&id=p00174284214 | 2026-06-26 17:47:58 | open | 0.00% | 670710 | Watch List | $0 | 0.00% | 0.41 | 0.821 | $0 | 0.00% | $0 | $0 | 0.00% | 0.00% | - | $70.00 | |||||||||||
| 2026-06-25 | AXTI | Amer. Xtal Tech. | Semiconductor | 99 | Small | $56.36 | 11.6924 | Wait for next Weekly Money Wave Close > 20 with High Volume. | 5100 | Long Term | Long | $0.00 | 0.00% | https://stockcharts.com/sc3/ui/?s=AXTI&a=2300207248&p=W&yr=0&mn=9&dy=0&id=p61016637531 | 2026-07-01 19:29:27 | open | 0.00% | 3144460 | Watch List | $0 | 0.00% | 0.00 | 0 | $0 | 0.00% | $0 | $0 | 0.00% | 0.00% | - | $105.00 |
Weekly Green Zone Pops- Click here for scrolling charts.
WEEKLY SWING TRADES
SELLS
ACHR Archer Aviation Target was Hit at $12.25 with a 24.2% Gain.
Completed Weekly Swing Trades thru Sep 2025: 25 Trades, +374% Total, or 15 % / Trade (before taxes & commissions).
______________________________________________________________________________
Important Links| Top 100 | Stage Chart Investing | CNN Fear & Greed Index |
| Dividend Growth Portfolio | ETF Sector Portfolio | Dogs of the Dow |
| Long Term Strategy | Stage Chart Investing | Articles |
Alert! Market Risk is Medium (Yellow). The probability of successful Short Term Trades is better, when the % of stocks above the 50-day avg. is below 20.
Tell your Friends about the Green Line, and Help Animals.
______________________________________________________________________________
QUESTION: Mike R writes “Please point me to a page with step-by-step instructions for setup.”
ANSWER: Please go to the DASHBOARD to follow the WATCH LIST on the Daily emails to see which Investments will have a Buy Signal soon.
Please follow the CURRENT POSITIONS on the Daily emails to see which Investments have been bought, and the Sell Stop Loss Exit prices.
Please follow the CLOSED POSITIONS on the Daily emails to see that past results of recent trades.
Most subscribers just follow the “BUYS TODAY” and “SELLS TODAY” sections in the Daily emails, and you will be current with the changes.
Charts are found by clicking on the symbol links and green dots on the pages above.
Good trading, and tell your friends!