
For busy investors that don’t have time to Swing Trade, we now have a simple Strategy:
Top Pick of the Week. You Buy the “Pick” on Monday morning, and then Sell on Friday’s Close. It’s a time-efficient approach designed to capture short-term gains without requiring constant market monitoring.
This “Pick” is emailed to you with this Weekly Commentary (see Pick below & more details here).
The Top Pick of the Week is still: ASE Tech Holding $ASX will be held for another week, as the Market & ASX were down. ASX still has 95 Relative Strength 0f 96, and should bounce soon. We will Sell on the Close Friday.
You can view the superior Weekly Stock Performance.
______________________________________________________________________________
DAILY SWING TRADING (SHORT TERM)Watch List and Charts to Buy Soon.
| Daily Swing Watch List to Buy | Daily Swing Charts to Buy |
| Current Daily Swing Positions | Current Swing Charts |
| Closed Daily Swing Results | Trading Dashboard |
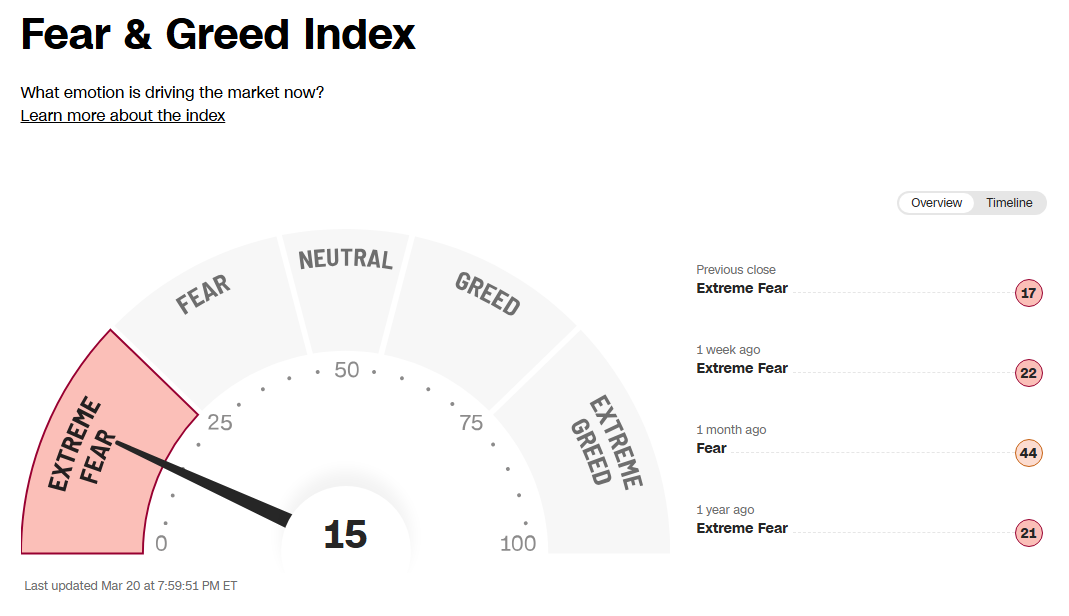
3/22/2026 Markets were sharply lower again for the week, as War Fears continued to cause the Weak Hands to Sell. When FEAR is High, we like to BUY. Many are concerned about high Crude Oil prices at $98, but the World wide Demand for Oil has not gone up. The Magician / Media is scaring the Herd out again, to create Opportunity of Gains for those who Buy on FEAR with Smart Money.
The major Stocks Indices are quickly back down to the Green Lines (like they always do) after the temporary Greed and FOMO (panic Buying) subsides. The S&P 500 CHART has come back down into the Green Zone, which historically creates maybe a “Once a Year” Buying Opportunity. The Semiconductor Index (SOXX) is holding up the best of the non-Oil Indices, and should bounce first.
Dumb Money bought Stocks on the Highs in January with borrowed money, and now they are having to Sell from Margin Calls. Many of the Tech & Momentum Stocks have dropped 30-50 % (probably too late to Sell). Dumb Money is Selling now as the Magician / Media is scaring them out.
We Buy the strongest Leaders that make new highs, on pull-backs. So follow the Green Line System and you should continue to win more than you lose. SEE WATCH LIST
With the Green Line System, your Money should flow into the Strongest areas and your Account value should be able to grow in both Bull and Bear Markets. Follow the MONEY, not the MEDIA.
______________________________________________________________________________
For the week the Dow was down 2.04%, the S&P 500 was down 1.90% and the NASDAQ 100 was down 1.96%. Try to own the stronger Funds here.
The Inflation Index (CRB) was up 0.36 % this week and is Above the Green Line, indicating Economic Expansion.
Bonds were down 0.82% for the week, and are Below the Green Line, indicating Economic Expansion.
The US DOLLAR was down 0.86% for the week.
Crude Oil was down 0.63 % for the week at $98.09 and GOLD was down 10.52% at $4494.
_______________________________________________________________________
DAY TRADERS: We are doing many profitable Day Trades at our Live Trading Room on YouTube during Market hours. Please join Discord or X (Twitter) with your cell phone app for the fastest Trade Alerts and Daily email notifications during the day. Other methods of notification have been too slow.
_______________________________________________________________________
COMPLETED DAILY SWING TRADES:
IBRX Immunity Bio Slipped down to the Buy Price and stopped out even.
We are now in 1 Three Star logged Swing Trading Positions for the Short Term. There are 3 investments on the Short Term Watch List.
Completed Swing Trades in 2025: 243 Trades, or 3.2% Avg. / Trade (before taxes and commissions). ______________________________________________________________________________
WEEKLY SWING TRADES – WATCH LIST
Watchlist is for Members Only
There are currently <strong>8</strong> investments on deck to be purchased, based on our Daily Swing Trading strategy.
| ✅ Every stock currently on deck | ✅ Real-time SCTR and price data |
| ✅ Daily % change tracking | ✅ Entry criteria and comments for each pick |
|
Already a Member? 🔒 LOG IN → |
Not a Member Yet? VIEW MEMBERSHIP PLANS → |
Current Watchlist (Preview)
Become a member to see exactly which stocks are on deck and why.
| Open Date | Symbol | Description | SCTR | Last Price | Daily Change % | Comments |
|---|---|---|---|---|---|---|
| 🔒 | 🔒 | 🔒 | 🔒 | 🔒 | 🔒 | Members Only |
| 🔒 | 🔒 | 🔒 | 🔒 | 🔒 | 🔒 | Members Only |
| 🔒 | 🔒 | 🔒 | 🔒 | 🔒 | 🔒 | Members Only |
| 🔒 | 🔒 | 🔒 | 🔒 | 🔒 | 🔒 | Members Only |
| 🔒 | 🔒 | 🔒 | 🔒 | 🔒 | 🔒 | Members Only |
| 🔒 | 🔒 | 🔒 | 🔒 | 🔒 | 🔒 | Members Only |
| 🔒 | 🔒 | 🔒 | 🔒 | 🔒 | 🔒 | Members Only |
| 🔒 | 🔒 | 🔒 | 🔒 | 🔒 | 🔒 | Members Only |
⭐ Join today to see our full watchlist and get alerted the moment we buy.
BECOME A MEMBER →Past performance is not indicative of future results.
Weekly Swing Trade Pops soon – Click here for scrolling charts.
WEEKLY SWING TRADES
CLS Celestica Inc. Weekly Swing Trade Buy, Target is $310.
W Wayfair Inc. Weekly Swing Trade Buy, Target is $100.
LMND Lemonade Inc. Sold via Trade Alert for a 12.6 % Gain.
Completed Weekly Swing Trades in 2025: 44 Trades, or 16 % / Trade (before taxes & commissions).
______________________________________________________________________________
Important Links| Top 100 | Stage Chart Investing | CNN Fear & Greed Index |
| Dividend Growth Portfolio | ETF Sector Portfolio | Dogs of the Dow |
| Long Term Strategy | Stage Chart Investing | Articles |
Alert! Market Risk is LOW (Green). The probability of successful Short Term Trades is better, when the % of stocks above the 50-day avg. is below 20.
Tell your Friends about the Green Line, and Help Animals.
______________________________________________________________________________
QUESTION: Jim S. writes “Why do you use the 250 vs 200 or any other moving average? And, in a bear market, are you concerned that your Money Wave (slow sto line) might get stuck in the Green Zone for an extended period or give false breakout buy signals?
ANSWER: Hi Jim. The 250-day average (Green Line) has been back tested and has fewer “false Sell Signals” than the 200-day. The question should be: Why do most investors use the inferior 200-day average?
In the next Bear Market, we should rotate into Inverse Funds (like SH) which we were in the 2008 Bear (with good success)… In a Bear Market, most investments will be Below the Green Lines. The Green Line Rules do not allow us to own the Inverse Funds yet.
But historically there will always be investments Above the Green Lines, and we should have them for you.
Good trading and tell your friends!
ATGL


