
The Top Pick of the Week System results in 2026: 14 Trades = +46.4% GAIN, while the S&P 500 was up 5.6%.
For busy investors that don’t have time to Swing Trade, we now have a simple Strategy:
Top Pick of the Week. You Buy the “Pick” on Monday morning, and then Sell on Friday’s Close. It’s a time-efficient approach designed to capture short-term gains without requiring constant market monitoring.
This “Pick” is emailed to you with this Weekly Commentary (see Pick below & more details here).
The Top Pick of the Week is: Century Aluminium $CENX Buy on the Open Monday, and Sell on the Close Friday. CENX does report Earnings after the Close on Thursday May 7th.
You can view the superior Weekly Stock Performance.
______________________________________________________________________________
DAILY SWING TRADING (SHORT TERM)Watch List and Charts to Buy Soon.
| Daily Swing Watch List to Buy | Daily Swing Charts to Buy |
| Current Daily Swing Positions | Current Swing Charts |
| Closed Daily Swing Results | Trading Dashboard |
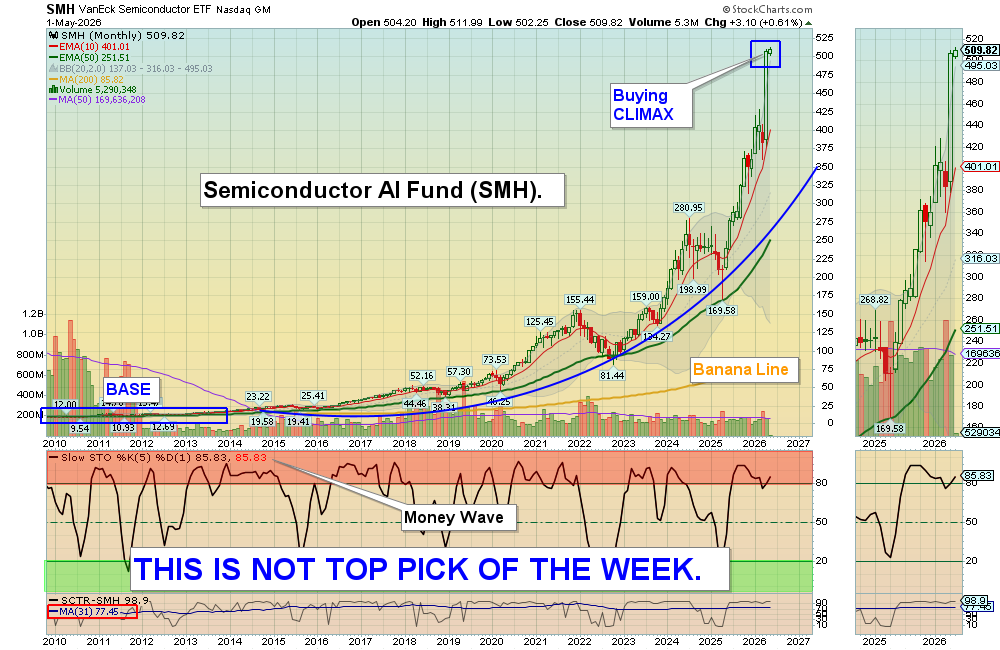
5/3/2026 Markets were mostly higher again for the week, even with Crude Oil bouncing up another 8.5 % to $102.46. Some of the major indices were able to make higher highs but are extremely over-bought and back up in the Red Zones (probably too late to Buy for the short term).
Some of the Indices (SPY, QQQ, & SMH) were able to bounce at the Pink Lines (10-day avgs.) to avoid short term Sell Signals. But the weaker Stock Indices (DOW 30. NYSE, & Transport) did not make higher highs, which can signal profit taking soon. We don’t want to get suckered in with the Fear of Missing Out (FOMO) Buyers, like Dumb Money is doing now. We are Raising CASH on Stocks that are not able to get back up near the Highs.
WAIT to Buy the Leaders that made highs recently, once they correct back down to the Green Zones. SEE WATCH LIST If you follow the Green Line System and you should continue to win more than you lose.
With the Green Line System, your Money should flow into the Strongest areas and your Account value should be able to grow in both Bull and Bear Markets. Follow the MONEY, not the MEDIA.
______________________________________________________________________________
For the week the Dow was up 0.57%, the S&P 500 was up 0.91% and the NASDAQ 100 was up 2.32%. Try to own the stronger Funds here.
The Inflation Index (CRB) was up 3.78 % this week and is Above the Green Line, indicating Economic Expansion.
Bonds were down 0.90% for the week, and are Above the Green Line, indicating Economic Contraction.
The US DOLLAR was down 0.33% for the week.
Crude Oil was up 8.54% for the week at $102.46 and GOLD was down 2.04% at $4612.97.
_______________________________________________________________________
DAY TRADERS: We are doing many profitable Day Trades at our Live Trading Room on YouTube during Market hours. Please join Discord or X (Twitter) with your cell phone app for the fastest Trade Alerts and Daily email notifications during the day. Other methods of notification have been too slow.
_______________________________________________________________________
COMPLETED DAILY SWING TRADES:
LXU LSB Industries Sold at break even.
SATL Satellogic Inc. Target was Hit with a 16.1 % Gain.
TEVA TEVA Pharma Target was Hit with a 1.7 % Gain.
TYRA Tyra BioSciences Inc. Sold at break even.
XLE Energy Stock Fund Stopped Out with a -1.9 % Loss.
We are now in 1 Three Star logged Swing Trading Positions for the Short Term. There are 2 investments on the Short Term Watch List.
Completed Swing Trades in 2025: 243 Trades, or 3.2% Avg. / Trade (before taxes and commissions). ______________________________________________________________________________
WEEKLY SWING TRADES – WATCH LIST
| Open Date | Symbol | Description | Industry | SCTR | Size | Last Price | Daily Change % | ATGL 60 Min | Comments | id | Strategy | Position | Sell Date | Sell Price | Purchase Price | Net Profit | Realized Gain/Loss % | ATGL Rule | Stop Loss | color | Chart | Update Date | Status | Unrealized Gain/Loss % | Volume | Post Type | # Shares | Amount Invested | Portfolio Weight | Dividend Rate | Current Yield | Current Value | Yield on Cost | Projected Annual Dividends | Total Dividends Received | Pay Back | Profit / Loss | Annualized Profit/Loss | Star Rating | Target Price | News Alert % | Target Triggered |
|---|---|---|---|---|---|---|---|---|---|---|---|---|---|---|---|---|---|---|---|---|---|---|---|---|---|---|---|---|---|---|---|---|---|---|---|---|---|---|---|---|---|---|
| 2026-07-08 | BW | Babcock & Wilcox | Financial | 96 | Small | $10.93 | -6.5812 | Wait for next Weekly Money Wave Close > 20 with High Volume. | 5123 | Long Term | Long | $0.00 | 0.00% | https://stockcharts.com/sc3/ui/?s=BW&a=2308001998&p=W&yr=1&mn=0&dy=0&id=p84859429849 | 2026-07-08 18:53:47 | open | 0.00% | 3578545 | Watch List | $0 | 0.00% | 0.00 | 0 | $0 | 0.00% | $0 | $0 | 0.00% | 0.00% | - | $17.00 | |||||||||||
| 2026-07-01 | NVTS | Navaitas Semi. | Semiconductor | 80 | Mid | $12.87 | -4.4543 | Wait for next Weekly Money Wave Close > 20 with High Volume. | 5114 | Long Term | Long | $0.00 | 0.00% | https://stockcharts.com/sc3/ui/?s=NVTS&a=2304700575&p=W&yr=1&mn=0&dy=0&id=p49574092537 | 2026-07-02 22:12:37 | open | 0.00% | 12117116 | Watch List | $0 | 0.00% | 0.00 | 0 | $0 | 0.00% | $0 | $0 | 0.00% | 0.00% | - | $24.00 | |||||||||||
| 2026-06-30 | NOK | Nokia Corp. | Telecom | 92 | Large | $11.69 | -6.0289 | Wait for next Weekly Money Wave Close > 20 with High Volume. | 5108 | Long Term | Long | $0.00 | 0.00% | https://stockcharts.com/sc3/ui/?s=NOK&a=2302004445&p=W&yr=1&mn=0&dy=0&id=p52583455345 | 2026-06-30 16:54:43 | open | 0.00% | 103877820 | Watch List | $0 | 0.00% | 0.16 | 1.3798 | $0 | 0.00% | $0 | $0 | 0.00% | 0.00% | - | $16.00 | |||||||||||
| 2026-06-29 | AAOI | Applied Opto | Telecom | 95 | Small | $111.88 | -6.7045 | Wait for next Weekly Money Wave Close > 20 with High Volume. | 5104 | Long Term | Long | $0.00 | 0.00% | https://stockcharts.com/sc3/ui/?s=AAOI&a=2300865339&p=W&yr=1&mn=6&dy=0&id=p68280620441 | 2026-07-05 19:24:45 | open | 0.00% | 6599643 | Watch List | $0 | 0.00% | 0.00 | 0 | $0 | 0.00% | $0 | $0 | 0.00% | 0.00% | - | $180.00 | |||||||||||
| 2026-06-26 | AA | Alcoa Corp. | Metals | 89 | Mid | $48.72 | 0.0822 | Wait for next Weekly Money Wave Close > 20 with High Volume. | 5101 | Long Term | Long | $0.00 | 0.00% | https://stockcharts.com/sc3/ui/?s=AA&a=2299172341&p=W&yr=1&mn=6&dy=0&id=p00174284214 | 2026-06-26 17:47:58 | open | 0.00% | 4041646 | Watch List | $0 | 0.00% | 0.40 | 0.821 | $0 | 0.00% | $0 | $0 | 0.00% | 0.00% | - | $70.00 | |||||||||||
| 2026-06-25 | AXTI | Amer. Xtal Tech. | Semiconductor | 99 | Small | $50.46 | -11.7986 | Wait for next Weekly Money Wave Close > 20 with High Volume. | 5100 | Long Term | Long | $0.00 | 0.00% | https://stockcharts.com/sc3/ui/?s=AXTI&a=2300207248&p=W&yr=0&mn=9&dy=0&id=p61016637531 | 2026-07-01 19:29:27 | open | 0.00% | 12456113 | Watch List | $0 | 0.00% | 0.00 | 0 | $0 | 0.00% | $0 | $0 | 0.00% | 0.00% | - | $105.00 |
Weekly Swing Trade Pops soon – Click here for scrolling charts.
WEEKLY SWING TRADES
TE T1 Energy Inc. Sold at break even.
Completed Weekly Swing Trades in 2025: 44 Trades, or 16 % / Trade (before taxes & commissions).
______________________________________________________________________________
Important Links| Top 100 | Stage Chart Investing | CNN Fear & Greed Index |
| Dividend Growth Portfolio | ETF Sector Portfolio | Dogs of the Dow |
| Long Term Strategy | Stage Chart Investing | Articles |
Alert! Market Risk is MEDIUM (Yellow). The probability of successful Short Term Trades is better, when the % of stocks above the 50-day avg. is below 20.
Tell your Friends about the Green Line, and Help Animals.
______________________________________________________________________________
5 Ways to Get your Daily Money Wave Email & Trade Alerts:
-
- Emailed to your box between 3:45 – 3:50 pm EST.
- Website menu Commentary/Buy/Sell Signals
- Discord Chat and X (Twitter) @AboveGreenLine are the fastest for Alerts (please set up “mobile notifications”)
- Text messages: Email us your Cell number & phone carrier (slower results & no more AT&T).
Thank you,
ATGL


