The Top Pick of the Week GDX Gold Miners Fund was Sold for a 6.2 % conservative Gain this week on a Trade Alert.
In 2026 the Top Pick Strategy had 5 trades totalling 24%, while the S&P 500 was up 1%.
For busy investors that don’t have time to Swing Trade, we now have a simple Strategy:
Top Pick of the Week. You Buy the “Pick” on Monday morning, and then Sell on Friday’s Close. It’s a time-efficient approach designed to capture short-term gains without requiring constant market monitoring.
This “Pick” is emailed to you with this Weekly Commentary (see Pick below & more details here).
The Top Pick of the Week is: Silver Fund $SLV to Buy on the Open Monday and Sell on the Close Friday.
You can view the superior Weekly Stock Performance.
______________________________________________________________________________
DAILY SWING TRADING (SHORT TERM)Watch List and Charts to Buy Soon.
| Daily Swing Watch List to Buy | Daily Swing Charts to Buy |
| Current Daily Swing Positions | Current Swing Charts |
| Closed Daily Swing Results | Trading Dashboard |
1/25/2026 Markets were mixed again for the week, but Bit-Coin and many Techs tanked on MAX FEAR. We are not Selling down here on FEAR. Dumb Money bought on the Highs with borrowed money and is now having to Sell from Margin Calls. We like to Buy on FEAR, and many of the Tech & Momentum Stocks have dropped 30-50 % (probably too late to Sell). Opportunity.
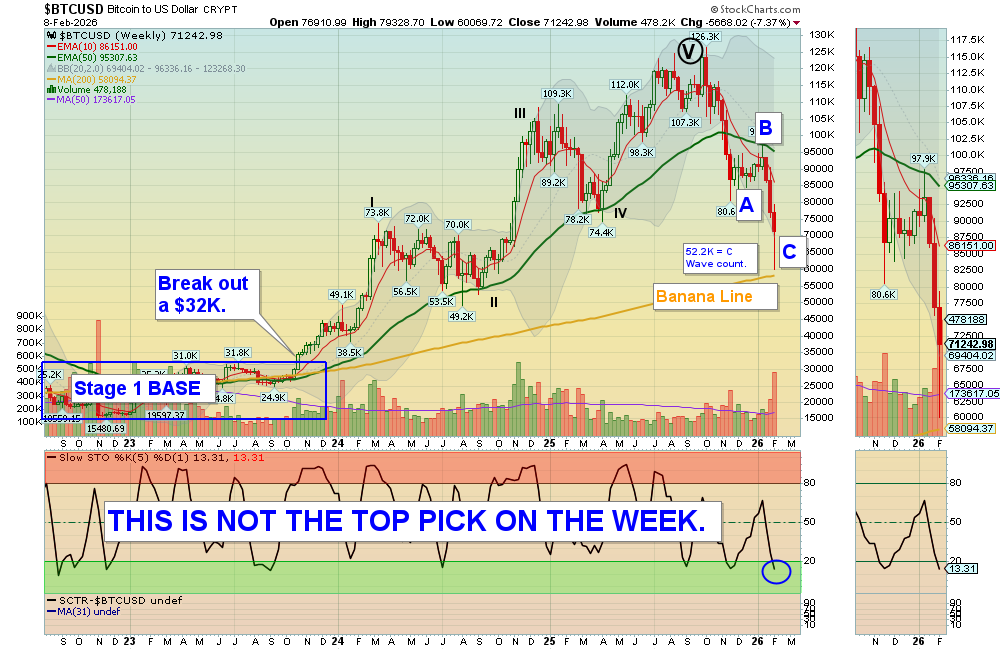
The Metal (Gold, Copper, Silver & Steel) are down near the 50-day averages and should bounce up soon to retest the recent Highs. BIT-Coin looks like a large 51 % A-B-C correction is almost complete, after a massive 3 year Bull and 5 Waves up.
The major Stocks Indices are struggling up here, as historically most Stocks are very expensive now. If you will need CASH later this year, probably take some profits up here and WAIT for another FEAR Flush by the Magician / Media, used to scare out the Dumb Money who Buys at the TOP (Markets have had a huge rally from the April lows).
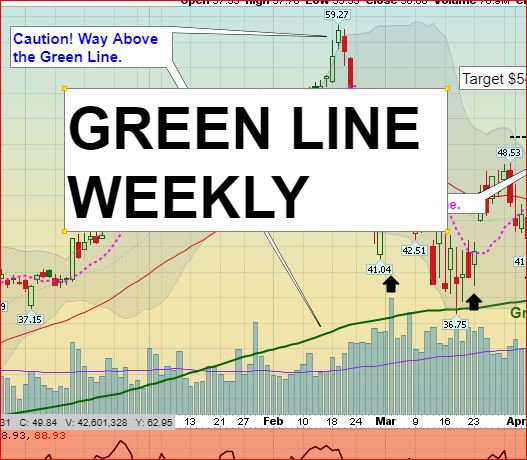
We Buy the strongest Leaders that make new highs, on pull-backs. So follow the Green Line System and you should continue to win more than you lose. SEE WATCH LIST
With the Green Line System, your Money should flow into the Strongest areas and your Account value should be able to grow in both Bull and Bear Markets. Follow the MONEY, not the MEDIA.
______________________________________________________________________________
For the week the Dow was up 2.45%, the S&P 500 was down 0.10% and the NASDAQ 100 was down 1.97%. Try to own the stronger Funds here.
The Inflation Index (CRB) was down 3.31%% this week and is Above the Green Line, indicating Economic Expansion.
Bonds were up 0.85% for the week, and are Above the Green Line, indicating Economic Contraction.
The US DOLLAR was up 0.72% for the week.
Crude Oil was down 2.62 % for the week at $63.50 and GOLD was up 1.58% at $4964.07.
_______________________________________________________________________
DAY TRADERS: We are doing many profitable Day Trades at our Live Trading Room on YouTube during Market hours. Please join Discord or X (Twitter) with your cell phone app for the fastest Trade Alerts and Daily email notifications during the day. Other methods of notification have been too slow.
_______________________________________________________________________
COMPLETED DAILY SWING TRADE TRADES:
AAPL Apple Inc. Sold via Trade Alert at break even.
We are now in 1 Three Star logged Swing Trading Positions for the Short Term. There are 4 investments on the Short Term Watch List.
Completed Swing Trades in 2025: 243 Trades, or 3.21% Avg. / Trade (before taxes and commissions). ______________________________________________________________________________
WEEKLY SWING TRADES – WATCH LIST
| Open Date | Symbol | Description | Industry | SCTR | Size | Last Price | Daily Change % | ATGL 60 Min | Comments | id | Strategy | Position | Sell Date | Sell Price | Purchase Price | Net Profit | Realized Gain/Loss % | ATGL Rule | Stop Loss | color | Chart | Update Date | Status | Unrealized Gain/Loss % | Volume | Post Type | # Shares | Amount Invested | Portfolio Weight | Dividend Rate | Current Yield | Current Value | Yield on Cost | Projected Annual Dividends | Total Dividends Received | Pay Back | Profit / Loss | Annualized Profit/Loss | Star Rating | Target Price | News Alert % | Target Triggered |
|---|---|---|---|---|---|---|---|---|---|---|---|---|---|---|---|---|---|---|---|---|---|---|---|---|---|---|---|---|---|---|---|---|---|---|---|---|---|---|---|---|---|---|
| 2026-07-19 | MRVL | Marvell Tech. | Semiconductor | 97 | Large | $210.99 | 1.457 | Wait for next Weekly Money Wave Close > 20 with High Volume. | 5131 | Long Term | Long | $0.00 | 0.00% | https://stockcharts.com/sc3/ui/?s=MRVL&a=2312856726&p=W&yr=1&mn=0&dy=0&id=p59074421066 | 2026-07-19 17:32:04 | open | 0.00% | 16777041 | Watch List | $0 | 0.00% | 0.24 | 0.1154 | $0 | 0.00% | $0 | $0 | 0.00% | 0.00% | - | $270.00 | |||||||||||
| 2026-07-08 | BW | Babcock & Wilcox | Financial | 96 | Small | $10.69 | -1.5654 | Wait for next Weekly Money Wave Close > 20 with High Volume. | 5123 | Long Term | Long | $0.00 | 0.00% | https://stockcharts.com/sc3/ui/?s=BW&a=2308001998&p=W&yr=1&mn=0&dy=0&id=p84859429849 | 2026-07-08 18:53:47 | open | 0.00% | 1832434 | Watch List | $0 | 0.00% | 0.00 | 0 | $0 | 0.00% | $0 | $0 | 0.00% | 0.00% | - | $17.00 | |||||||||||
| 2026-07-01 | NVTS | Navaitas Semi. | Semiconductor | 80 | Mid | $12.67 | -1.2086 | Wait for next Weekly Money Wave Close > 20 with High Volume. | 5114 | Long Term | Long | $0.00 | 0.00% | https://stockcharts.com/sc3/ui/?s=NVTS&a=2304700575&p=W&yr=1&mn=0&dy=0&id=p49574092537 | 2026-07-02 22:12:37 | open | 0.00% | 12808800 | Watch List | $0 | 0.00% | 0.00 | 0 | $0 | 0.00% | $0 | $0 | 0.00% | 0.00% | - | $24.00 | |||||||||||
| 2026-06-30 | NOK | Nokia Corp. | Telecom | 92 | Large | $10.28 | -3.2926 | Wait for next Weekly Money Wave Close > 20 with High Volume. | 5108 | Long Term | Long | $0.00 | 0.00% | https://stockcharts.com/sc3/ui/?s=NOK&a=2302004445&p=W&yr=1&mn=0&dy=0&id=p52583455345 | 2026-06-30 16:54:43 | open | 0.00% | 91228365 | Watch List | $0 | 0.00% | 0.16 | 1.5174 | $0 | 0.00% | $0 | $0 | 0.00% | 0.00% | - | $16.00 | |||||||||||
| 2026-06-29 | AAOI | Applied Opto | Telecom | 95 | Small | $110.52 | -7.3285 | Wait for next Weekly Money Wave Close > 20 with High Volume. | 5104 | Long Term | Long | $0.00 | 0.00% | https://stockcharts.com/sc3/ui/?s=AAOI&a=2300865339&p=W&yr=1&mn=6&dy=0&id=p68280620441 | 2026-07-05 19:24:45 | open | 0.00% | 8178039 | Watch List | $0 | 0.00% | 0.00 | 0 | $0 | 0.00% | $0 | $0 | 0.00% | 0.00% | - | $180.00 | |||||||||||
| 2026-06-25 | AXTI | Amer. Xtal Tech. | Semiconductor | 99 | Small | $52.98 | -6.2467 | Wait for next Weekly Money Wave Close > 20 with High Volume. | 5100 | Long Term | Long | $0.00 | 0.00% | https://stockcharts.com/sc3/ui/?s=AXTI&a=2300207248&p=W&yr=0&mn=9&dy=0&id=p61016637531 | 2026-07-01 19:29:27 | open | 0.00% | 4887567 | Watch List | $0 | 0.00% | 0.00 | 0 | $0 | 0.00% | $0 | $0 | 0.00% | 0.00% | - | $105.00 |
Weekly Green Zone Pops – Click here for scrolling charts.
WEEKLY SWING TRADES NONE
Completed Weekly Swing Trades in 2025: 44 Trades, or 16 % / Trade (before taxes & commissions).
______________________________________________________________________________
Important Links| Top 100 | Stage Chart Investing | CNN Fear & Greed Index |
| Dividend Growth Portfolio | ETF Sector Portfolio | Dogs of the Dow |
| Long Term Strategy | Stage Chart Investing | Articles |
Alert! Market Risk is Medium (Yellow). The probability of successful Short Term Trades is better, when the % of stocks above the 50-day avg. is below 20.
Tell your Friends about the Green Line, and Help Animals.
______________________________________________________________________________
QUESTION: Jackie writes “Been reading your informative articles and FAQs. Is there a way I can enter a stock such as BA or an ETF symbols and see them shown as ATGL chart with red/green zones, MAs, sector ranking, Green Line etc?”
ANSWER: Yes. Near the bottom of each Daily email, look for: ARE YOUR INVESTMENTS ABOVE THE GREEN LINE?
Please Click on the link (To make the Chart larger, please change the SIZE to Landscape and then Update.)
Good trading and tell your friends!
ATGL