
9/11/2022 Markets were sharply higher for the week as the Indices were very over-sold for the short term. Smart Money came in and bought on the FEAR, and Short Sellers bought back stocks that they had shorted. But it is obvious to all now that without the FED Printing, the Stock Market has no power.
So what will it take for the FED to print again? The Markets have been adjusting for FED tightening (raising the Fed Funds rate) and will probably raise another 3/4% on Sept 21. Eventually this will cause the Economy to slow down and Inflation and Commodities should weaken. There is a good chance the Economy will Tank much worse than expected, so the FED will probably Print again, like they did for 13 years…
If you continue to Follow the Green Line System, your Money should flow into the Strongest areas and your account value should be able to grow in both Bull and Bear Markets.
________________________________________________________________________________________________________________________________________________
More action this week on the Day Trading Scrolling Charts.
DAY TRADING CHARTS FOR INDICES & LARGE CAPS.
We have not had many intra-day Trade Alert signals lately as the Volume has been too Low with the Buy Signals. These low Volume Buy Signals tend to pop up and quickly fade back down. We like to see High Volume on rallies.
For the week the Dow was up 2.72%, the S&P 500 was up 3.66%, and the NASDAQ 100 up 4.04%. Currently the major Stock Indices are now back Below the Green Lines and have low Relative Strength (own stronger Investments here).
The Inflation Index (CRB) was down 0.12% for the week and is slightly Above the Green Line, indicating Economic Expansion.
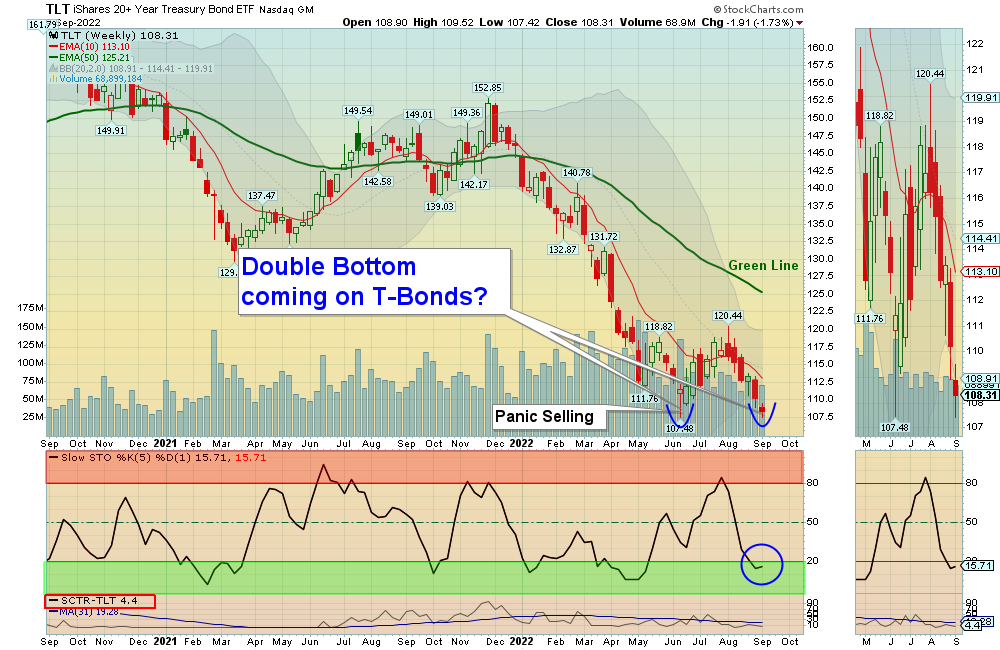
Bonds were down 1.73 for the week, and are Below the Green Line, indicating Economic Expansion.
The US DOLLAR was down 0.47% for the week and is Way Above the Green Line.
Crude Oil was down 0.09% for the week at $86.79 and GOLD was up 0.35% at $1728.60.
_____________________________________________________________________________________________
MONEY WAVE BUYS SOON:
We are in now in 9 logged Current Positions for the Short & Medium Term. There are 4 investments on the Short Term Watch List.
Be patient and WAIT for Green Zone Buy Signals!
_________________________________________________________________________________________
LONG TERM INVESTMENTS: (Hard to find many Long Term now because most normal Investments no longer have 80 Relative Strength required.)
Long Term Scrolling Charts (Real Time)
ABBV ABBVIE INC. Buy if it Closes above $143.98 with High Volume.
GOGL GOLDEN OCEAN GROUP Buy if it Closes above $11.37 with High Volume.
SIGA SIGA TECH. Wait for Weekly Money Wave Close > 20.
USO US OIL FUND Buy if it Closes above $76.97 with High Volume.
VIPS VIPSHOP HOLDINGS Buy if it Closes above $13.32 with High Volume. (now in nice Stage 1 Base).
_______________________________________________________________________________
My Trading Dashboard
Swing Trading Scrolling Charts
Day Trading Scrolling Charts
Click for Watch Lists
Click for Current Positions
Click for Closed Positions
Updated Top 100 List Sep 1, 2022
Dividend Growth Portfolio
Updated ETF Sector Rotation System
Dogs of the DOW System
Long Term Strategy for IRAs & 401k Plans
CNN Fear & Greed Index
Scrolling Stage Chart Investing Charts
Alert! Market Risk is Medium (YELLOW). The probability of successful Short Term Trades is better, when the % of stocks above the 50-day avg. is below 20.
Tell your Friends about the Green Line, and Help Animals.
________________________________________________________________________________
QUESTION: Jim S. writes “Why do you use the 250 vs 200 or any other moving average? And, in a bear market, are you concerned that your Money Wave (slow sto line) might get stuck in the Green Zone for an extended period or give false breakout buy signals?
ANSWER: Hi Jim. The 250-day average (Green Line) has been back tested and has fewer “false Sell Signals” than the 200-day. The question should be: Why do most investors use the inferior 200-day average?
In the next Bear Market, we should be in Inverse Funds (like SH) which we were in the 2008 Bear (with good success)… In a Bear Market, most investments will be Below the Green Lines. The Green Line Rules do not allow us to own weaker investments Below the G L.
But historically there will always be investments Above the Green Lines, and we should have them for you.
Good trading and tell your friends!
ATGL
