By Andrew Stowers
Updated May 14, 2026
Hedge funds have a reputation that precedes them — secretive, exclusive, reserved for the ultra-wealthy, and presumed to deliver returns that mere mortals cannot access.
Some of that reputation is deserved. Most of it is myth. This guide strips away the mystique: exactly how hedge funds operate, what the fee structure actually costs investors over time, what the performance data shows when you account for survivorship bias, and — most practically — how self-directed investors can apply the best ideas from hedge fund strategy without paying hedge fund fees to access them. By using this resource in addition to our ETF Investing Guide, you will have a masterful hand on managing your portfolio.
What Is a Hedge Fund? (And How It Differs From Everything Else)
| Quick Answer
A hedge fund is a pooled alternative investment vehicle that uses flexible strategies — including leverage, short-selling, derivatives, and concentrated positions — to seek positive absolute returns regardless of market direction. Unlike mutual funds and ETFs, hedge funds are lightly regulated, restricted to accredited investors, and governed by the ‘2 and 20’ fee structure. |
The term ‘hedge fund’ is both specific and misleading. Specific, in that it refers to a legally defined private investment partnership structure. Misleading, in that most modern hedge funds do not primarily hedge — they do not systematically offset risk exposure. The name is a historical artifact from the original long/short equity funds of the 1940s and 50s that genuinely hedged long positions with short ones.
Legal Structure and Regulatory Exemptions
Hedge funds are typically structured as limited partnerships (LPs). The fund manager operates as the general partner (GP), making all investment decisions and receiving management and performance fees. Investors are limited partners — they contribute capital and share in profits and losses, but have no role in day-to-day management and limited legal liability.
The exemption that enables hedge fund flexibility: most hedge funds are exempt from registration under the Investment Company Act of 1940 — the legislation that governs mutual funds. This exemption allows them to use leverage, take short positions, trade derivatives, invest in illiquid assets, and concentrate positions in ways that regulated mutual funds cannot. In exchange, they are restricted from marketing to the general public and must limit their investor base to qualified individuals.
What Hedge Funds Can Do That Others Cannot
- Go short: profit from falling asset prices by borrowing and selling securities they do not own, with the intent to repurchase them later at a lower price
- Use leverage: borrow capital to amplify position sizes — a fund with $1B under management may control $3-4B in total exposure
- Invest in derivatives: options, futures, swaps, and other instruments that regulate funds cannot easily access
- Concentrate aggressively: a hedge fund can put 30% of its portfolio in a single position; a mutual fund is typically limited to 5% per position
- Invest in illiquid assets: private credit, distressed debt, real estate, and private equity — assets that exchange-traded funds cannot hold
Who Can Invest in Hedge Funds? The Accredited Investor Barrier
| Accredited Investor Definition
An individual qualifies as an accredited investor if they meet any ONE of: (1) net worth over $1 million excluding primary residence, (2) annual income over $200,000 — or $300,000 with a spouse — in each of the two most recent years, or (3) a holder of Series 7, 65, or 82 financial license. Approximately 90% of U.S. households do not meet these thresholds. |
The accredited investor threshold is not about keeping ordinary people out of sophisticated investments as an act of elitism — it is the SEC’s determination that individuals below these thresholds may lack the financial cushion to absorb potentially total losses in complex, illiquid strategies. The regulatory logic: if an investment goes to zero, an accredited investor can survive it. Most others cannot.
The Qualified Purchaser Standard (The Higher Bar)
Some hedge funds require an even higher threshold: qualified purchaser status. Under this designation, an individual must hold $5 million or more in investments (not including the value of their primary residence or business). Families and entities need $25 million. Qualified purchaser status allows funds to take on up to 500 investors rather than the 100-investor limit that applies to funds open only to accredited investors. Elite funds typically require qualified purchaser status.
Practical Minimums and Liquidity Constraints
Meeting the accredited investor threshold gets you through the legal door. The practical minimums are a separate matter:
- Standard funds: $100,000–$500,000 minimum investment
- Institutional funds: $1 million–$5 million minimum
- Elite quantitative funds: $5 million–$10 million or higher; most are closed to new investors entirely
Lock-up periods are the often-overlooked constraint: most hedge funds impose an initial lock-up period of one to three years during which capital cannot be withdrawn at all. Even after the lock-up expires, redemptions are typically permitted only quarterly or annually, with advance notice requirements of 30–90 days. Your capital is not liquid in the way a stock or ETF is — entering a hedge fund is more like making a multi-year commitment than buying a security.
The Six Main Hedge Fund Strategies
The term ‘hedge fund’ encompasses an enormous range of approaches. The six strategy categories below cover the primary frameworks — though real funds often blend or modify these in practice.
1. Long/Short Equity
The original hedge fund strategy. Long/short equity funds buy stocks they believe are undervalued while simultaneously short-selling stocks they believe are overvalued. In theory, this creates a portfolio that profits from stock selection skill — correctly identifying relative winners and losers — with reduced exposure to overall market direction. Market-neutral variants aim to maintain near-zero net market exposure; most long/short equity funds maintain a net long bias.
2. Global Macro
Global macro funds express directional views on currencies, interest rates, commodities, and equity indices — typically through futures and derivatives rather than individual securities. Managers analyze broad economic trends, policy decisions, and geopolitical developments. George Soros’s famous 1992 short of the British pound is the most celebrated macro trade in history. Global macro can be discretionary (driven by human judgment) or systematic (algorithmic rule-based execution).
3. Event-Driven
Event-driven funds profit from corporate events: mergers (merger arbitrage — buying the acquisition target and sometimes shorting the acquirer), bankruptcies (distressed debt — buying debt of distressed companies at a discount before restructuring), spinoffs, and recapitalizations. Returns depend on the probability and timing of event completion rather than market direction. Well-executed event-driven investing can be genuinely uncorrelated to equity markets.
4. Quantitative / Systematic
Quant funds use algorithm-driven models to identify and exploit statistical patterns across large datasets. Renaissance Technologies’ Medallion Fund — reportedly generating approximately 66% gross annual returns over three decades — is the most documented example of extraordinary quant success. The fund is closed to outside investors; the returns belong almost entirely to fund employees. Most other quant funds have not replicated this kind of persistent edge, as statistical patterns are often arbitraged away once discovered.
5. Arbitrage
Arbitrage funds exploit pricing discrepancies between related securities. Convertible bond arbitrage (buying convertible bonds while shorting the underlying stock), statistical arbitrage (short-term mean-reversion trades in related securities), and fixed income arbitrage (exploiting yield curve anomalies) are common approaches. Arbitrage strategies typically generate small returns per trade but at high frequency; significant leverage is often required to produce meaningful absolute returns.
6. Multi-Strategy
Multi-strategy funds allocate capital across multiple strategy buckets — often managed by distinct specialist teams within the same organization. Citadel and Millennium Management are among the largest and most prominent multi-strategy platforms. The diversification across strategies reduces dependence on any single market regime or edge type. When one strategy struggles, others may be generating returns, smoothing overall fund performance. This structure also allows funds to reallocate capital rapidly to the strategies with the highest current opportunity.
The 2-and-20 Fee Structure: What Hedge Funds Actually Cost You
| The 2-and-20 Structure
2% annual management fee on total assets under management, charged regardless of performance. PLUS 20% performance fee on all profits generated above the fund’s previous high-water mark. Together, these two fees consume a substantial portion of gross investment returns — often more than most investors realize when expressed as annual percentages. |
Breaking Down Each Component
The 2% management fee: charged annually on your total invested assets regardless of whether the fund makes money. On a $1 million investment, this is $20,000 leaving your account in year one — before the fund has generated a single dollar of profit. In a flat or slightly down year, you still pay $20,000. Over 10 years, the management fee alone on a $1M investment compounds into a very substantial cost.
The 20% performance fee: charged on profits above the fund’s high-water mark — the previous highest value of the investment. If a fund earns 15% gross in a year, approximately 3% (20% of 15%) goes to the manager as performance fee, leaving the investor with approximately 12% net before the management fee. Combined: approximately 10% net to the investor from 15% gross.
The high-water mark: a partial investor protection — the manager cannot charge a new performance fee after a loss until the fund recovers to its prior peak. If a fund falls 20%, the manager must earn back that 20% before collecting performance fees again. This prevents double-charging on recovery but does not eliminate the asymmetric incentive structure.
The Dollar Cost: What 2-and-20 Actually Consumes
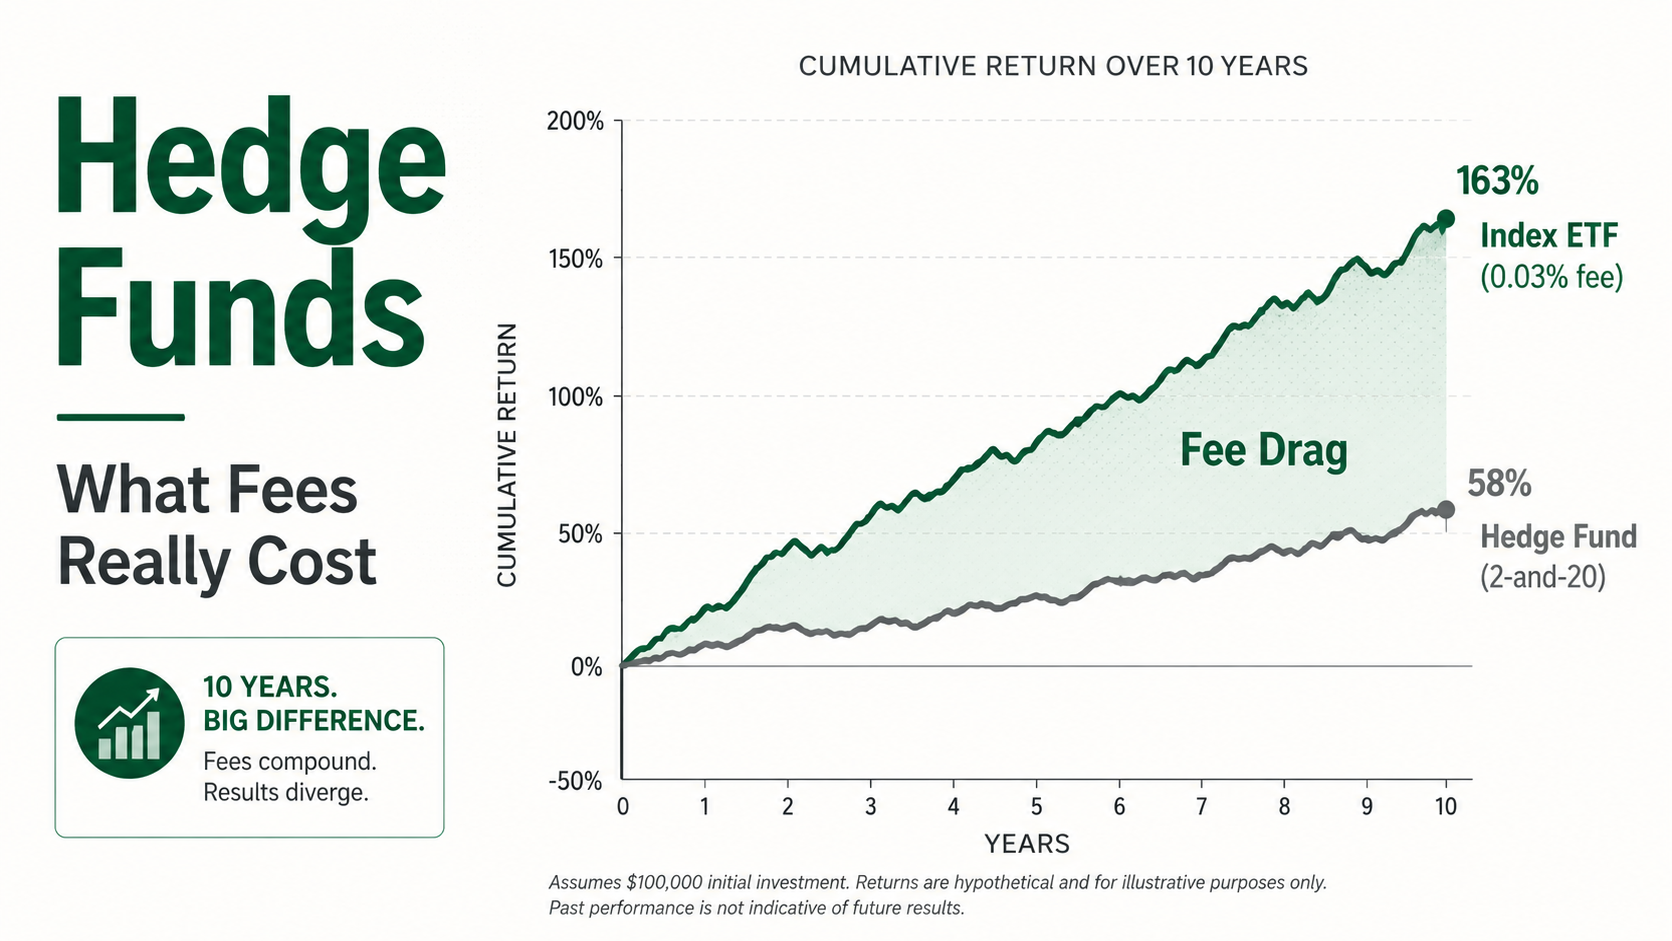
The table below compares a $1 million investment generating 10% gross annual returns over 10 years in a 2-and-20 hedge fund versus a 0.03% passive index ETF generating the same gross return.
| Metric | Hedge Fund (2-and-20) | Index ETF (0.03%) |
|---|---|---|
| Initial Investment | $1,000,000 | $1,000,000 |
| Gross Annual Return (assumed) | 10% | 10% |
| Net Annual Return (approx.) | ~6.5–7.5% | ~9.97% |
| Approx. 10-Year End Balance | ~$1,880,000–$2,060,000 | ~$2,590,000 |
| Approx. Total Fees Paid | ~$530,000–$710,000 | ~$10,000 |
Figures are illustrative approximations based on simplified annual calculations. Actual outcomes depend on fund-specific terms, performance pattern, and drawdown history. Verify with a compound return calculator.
The gap — $530,000 to $710,000 in fees on a $1 million investment generating the same gross return — is not a theoretical number. It is the compounding mathematics of paying 2% plus 20% annually on a growing balance. The hedge fund manager captures a significant share of what would otherwise be investment growth.
Fee compression: industry-wide average fees have declined from the classic 2-and-20 toward approximately 1.4% management and 17% performance as institutional investors negotiate harder terms. But even at these reduced levels, the cost differential versus passive alternatives remains enormous.
The Performance Reality: What the Data Actually Shows
The fee structure would be entirely worth paying if hedge funds consistently delivered returns that justified it. The data suggests that for most funds, they do not.
Average Underperformance After Fees
Academic research and institutional investor performance tracking consistently show that the average hedge fund has underperformed a simple S&P 500 index fund over most 10-year rolling periods, net of the 2-and-20 fee structure. The gap is not marginal — in many measured periods, the index outperforms by 3–5% annually on a net basis.
Survivorship Bias: Why Reported Returns Are Inflated
The most important statistical distortion in hedge fund performance data is survivorship bias. When a hedge fund fails and closes — as thousands do annually — its historical performance record is typically removed from industry databases. The performance history you see reported for ‘hedge funds as an asset class’ reflects only those funds that survived to the measurement date. The failures — which dragged actual investor returns downward — are invisible in the aggregate statistics.
This means that any reported ‘average hedge fund return’ is systematically higher than what the average hedge fund investor actually experienced, because the worst-performing funds no longer appear in the sample.
The Warren Buffett Bet
In 2007, Warren Buffett made a public $1 million wager: a simple S&P 500 index fund — specifically the Vanguard S&P 500 fund — would outperform a basket of hedge funds net of all fees over the following 10 years. A hedge fund manager, Ted Seides of Protégé Partners, accepted the bet on behalf of five hedge funds of funds. When the bet concluded in 2017, the S&P 500 index fund had returned approximately 7.1% annually. The hedge fund basket returned approximately 2.2% annually. The index fund won decisively, and the gap was not close.
The Exceptions Are Real — and Instructive
The funds that have generated genuine, sustained long-run alpha are almost exclusively systematic and quantitative. Renaissance Technologies’ Medallion Fund — which employs a staff of physicists, mathematicians, and computer scientists to develop proprietary trading algorithms — is the most documented case of exceptional performance. Citadel, Two Sigma, and DE Shaw have also built multi-decade track records of significant outperformance. The common thread: these are not discretionary stock-pickers. They are systematic, rules-based operations that remove human emotion from the investment process.
Most of these funds are closed to outside investors. Their success is not accessible to you through investment. But their methodology — systematic, quantitative, rules-based — absolutely is.
Hedge Funds vs Mutual Funds vs ETFs: An Honest Comparison
Most investors are not choosing between hedge funds and index ETFs — they cannot access hedge funds. But understanding the full spectrum of pooled investment vehicles helps clarify where the real choices lie.
| Feature | Hedge Fund | Mutual Fund | Active ETF | Passive ETF |
|---|---|---|---|---|
| Access | Accredited only | Open to all | Open to all | Open to all |
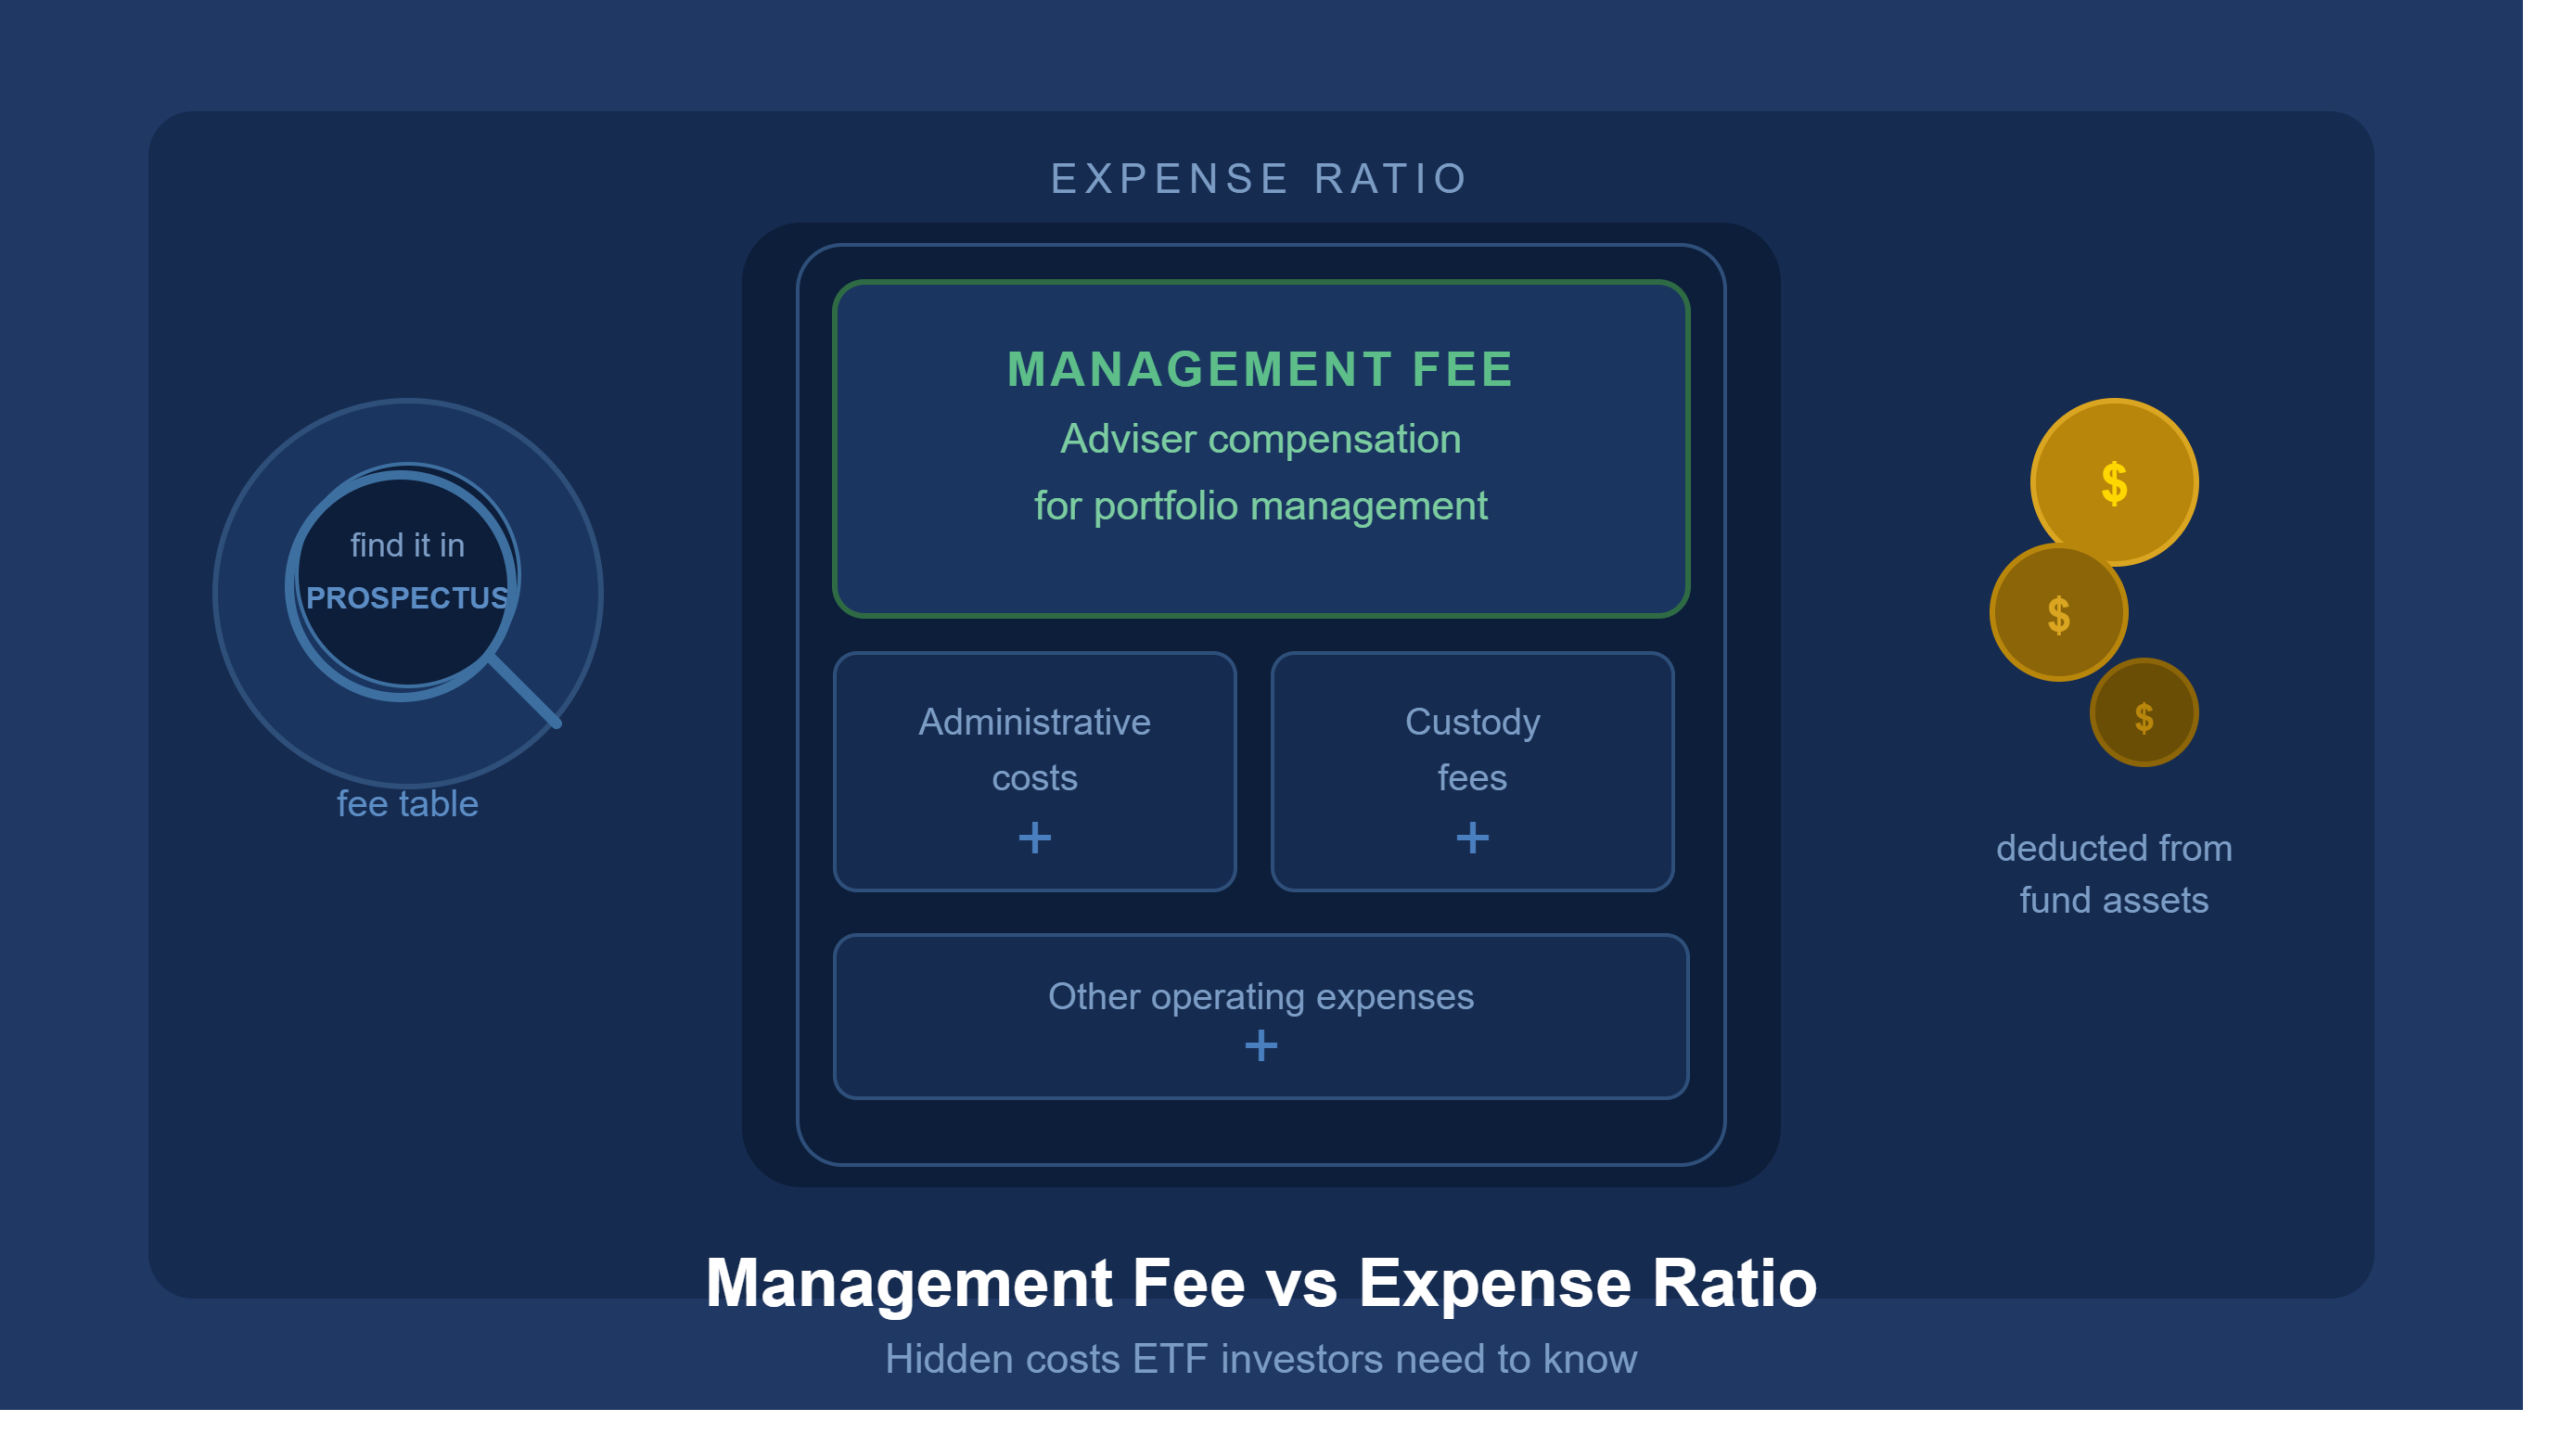
| Typical Fee | 2% + 20% perf. | 0.5–1.5% ER | 0.2–0.75% ER | 0.03–0.20% ER |
| Strategy Flexibility | Maximum | Constrained | Moderate | Benchmark-bound |
| Liquidity | Locked (1–3yr) | Daily NAV | Intraday | Intraday |
| Min. Investment | $100K–$1M+ | Low/none | Share price | Share price |
| Regulation | Light (LP exempt) | Heavy (ICA) | Moderate (40 Act) | Moderate (40 Act) |
| Avg. vs Benchmark | Below (after fees) | Below (after fees) | Mixed | Tracks benchmark |
The practical verdict for most investors: the relevant comparison is not between hedge funds and index ETFs. It is between active ETFs running systematic or factor-based strategies versus passive index ETFs. Both are accessible without accreditation, tradeable intraday, and charge fees that are an order of magnitude lower than hedge fund structures.
Active ETFs that employ quantitative or systematic approaches bring a meaningful portion of hedge fund methodology to retail investors at accessible cost and with full liquidity. They do not replicate the most sophisticated multi-billion-dollar quant fund operations — but they bring the intellectual framework within reach.
Can Self-Directed Investors Think Like a Hedge Fund?
| The Key Insight
The hedge funds that generate genuine, sustained long-run alpha are uniformly systematic, rules-based operations that remove emotion from decision-making. That methodology is not locked behind accreditation thresholds or minimum investments. It is an approach available to any investor willing to build and follow a disciplined process. |
Principle 1: Systematic, Rules-Based Decision-Making
The defining characteristic of the elite performing funds — Renaissance, Citadel’s quantitative division, Two Sigma, DE Shaw — is not that their managers are smarter than everyone else. It is that their investment process is systematic: every position is entered and exited according to predefined criteria, not real-time emotional judgment.
Self-directed investors can apply this directly. Define your entry criteria before looking at a stock. Define your exit before entering a position. Run your trades against a documented ruleset. The process discipline that separates the best fund managers from average ones is entirely replicable at the retail level — it requires commitment, not capital.
Principle 2: Rigorous Risk Management
Every serious hedge fund has explicit drawdown limits, position sizing rules, and portfolio-level risk constraints. A quant fund does not size a position based on conviction — it sizes based on the statistical relationship between the position’s expected return, its volatility, and its correlation to existing holdings.
At the retail level, the translation is the 1-2% position sizing rule and a minimum 2:1 risk/reward ratio on every trade: never risk more than 1-2% of portfolio on any single position, and only enter trades where the potential reward is at least double the defined risk. These are not restrictions on your potential return — they are the architecture that keeps you in the game long enough to let your edge compound.
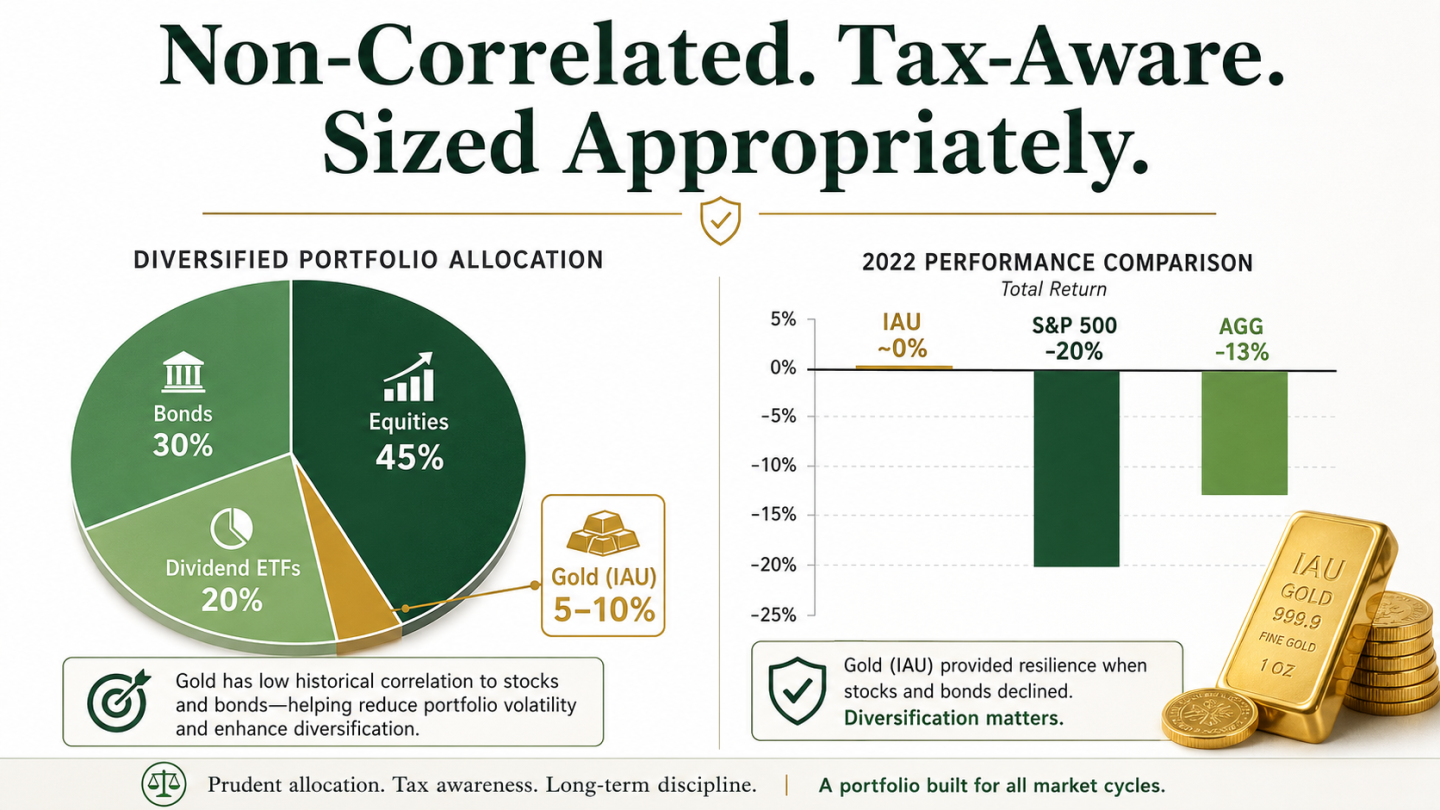
Principle 3: Non-Correlated Strategy Layering
Multi-strategy hedge funds layer approaches with low correlation to each other, so that when one strategy struggles, others continue generating returns. Self-directed investors can apply the same concept: a passive index core (broad market exposure, low cost) plus an active swing trading satellite (tactical, short-to-medium term, rules-based) creates two distinct return streams that do not depend on the same market conditions simultaneously.
Principle 4: Process Discipline Through Adverse Periods
The most consistent finding in hedge fund research is that the managers who build multi-decade records do not abandon their process when it underperforms in the short term. This is the insight most retail investors never successfully apply. A rules-based system that underperforms the market for six months is not necessarily broken — it may simply be in a market regime that does not favour it. Abandoning the process at the moment of short-term underperformance is the most reliable way to miss the subsequent period of outperformance.
Systematic process adherence is free. It requires no accreditation, no $1 million minimum, and no lock-up period. It requires only the discipline to build the rules first and follow them under pressure.
The Bottom Line on Hedge Funds
Hedge funds are genuinely sophisticated vehicles with structural advantages that retail investors cannot replicate — the ability to go short, deploy leverage, invest in illiquid assets, and concentrate aggressively in high-conviction positions. For investors who qualify and find a fund with proven edge, there is a legitimate case for participation.
For everyone else — which is to say, for approximately 90% of investors — the relevant takeaway from hedge fund research is not about access. It is about methodology. The funds that outperform consistently are systematic, disciplined, and process-driven. Their edge is not genius or secrecy. It is the rigorous application of a rules-based framework, executed without emotional override, through both favourable and adverse market conditions.
That methodology is available to every self-directed investor. It does not require a $1 million minimum or a three-year lock-up. It requires a system — and the discipline to follow it.
| Build the System With ATGL
At AboveTheGreenLine.com we give self-directed investors the rules-based framework that the best systematic fund managers use — applied to accessible instruments at a fraction of the cost. No accreditation required. No lock-up. No 2-and-20. Join us Above the Green Line and get access to the complete system, real-time alerts, and a community of investors who take process as seriously as the professionals. |
Frequently Asked Questions
How do hedge funds make money?
Hedge funds earn money through two fee streams: a management fee (typically 2% of assets under management annually, charged regardless of performance) and a performance fee (typically 20% of any profits generated above the fund’s previous high-water mark). Fund managers also invest their own capital alongside clients, profiting from returns on that personal investment. The 2-and-20 structure means managers are compensated substantially even in years where performance is modest.
Can ordinary people invest in hedge funds?
Most hedge funds are restricted to accredited investors — individuals with net worth over $1 million excluding primary residence, or annual income over $200,000. Many funds additionally require qualified purchaser status ($5M+ in investments). This excludes approximately 90% of U.S. households. Accessible alternatives using similar strategies include active ETFs, liquid alternative funds, and systematic trading strategies available through standard brokerage accounts.
Do hedge funds outperform the stock market?
On average, no. Research consistently shows that most hedge funds underperform the S&P 500 index over 10-year periods after accounting for the 2-and-20 fee structure. Survivorship bias — the removal of failed funds from databases — inflates reported averages. A small number of elite quantitative funds (Renaissance Technologies being the most documented) have generated genuine long-run alpha, but these are closed to outside investors.
What is the minimum investment in a hedge fund?
Hedge fund minimum investments typically range from $100,000 to $1 million or more. Elite quantitative funds may require $5 million or higher, and most are closed to new investors entirely. Beyond the minimum, most funds impose lock-up periods of one to three years during which capital cannot be withdrawn, with quarterly or annual redemption windows thereafter. The combination of financial thresholds, minimums, and illiquidity makes hedge funds impractical for most investors.

Related Articles
[pt_view id=”fb2451fm3r”]