By Andrew Stowers
Updated June 16, 2026
Growth ETFs offer some of the strongest long-run total returns in the ETF universe — and some of the most concentrated portfolio risk dressed as diversification.
VUG holds approximately 230 stocks. The top 10 of them typically represent nearly half the fund’s value. QQQ holds 100 stocks; its top 10 can represent 55% or more. An investor who owns a growth ETF believing they are broadly diversified across high-growth companies may actually be running a portfolio dominated by five to ten mega-cap technology names.
This guide explains what growth ETFs actually hold, how the major funds compare, when they outperform and underperform, and how to position them appropriately in a complete portfolio. After finishing this article, we encourage you to visit our ETF Investing Guide for a deeper dive into the world of ETFs.
What Are Growth ETFs? How Stocks Qualify as ‘Growth’
| Quick Answer
Growth ETFs hold indices of stocks selected for above-average revenue and earnings growth expectations, typically at higher valuation multiples. They prioritize capital appreciation over income, pay minimal dividends (~0.5-1.5% yield), and concentrate heavily in technology and consumer discretionary sectors. |
The word ‘growth’ in a growth ETF refers to a specific index construction methodology, not a general description. Major index providers — Russell, S&P, CRSP, Morningstar — use quantitative factors to classify stocks across a growth-value spectrum. Common factors include:
- 3-year revenue and earnings growth rate
- Price-to-earnings (P/E) ratio relative to peers
- Price-to-book (P/B) ratio
- Earnings growth forecasts
Stocks scoring above the growth threshold on these factors enter growth indices; those below enter value indices; those in between may be allocated to blend, or split between growth and value indices. This methodology means the index construction is mathematical — not all intuitively ‘high-growth’ companies will be in a growth index, and some companies classified as growth may not be growing rapidly at a given moment.
Why Growth Stocks Pay Minimal Dividends
Growth companies typically reinvest earnings to fund expansion — new products, acquisitions, R&D, geographic expansion — rather than returning capital to shareholders as dividends. The investor’s return comes through price appreciation as the business grows. This makes growth ETFs highly tax-efficient in taxable accounts: minimal annual dividend income means minimal annual tax events, with compounding occurring without forced annual distributions.
Growth vs Momentum: An Important Distinction
Growth and momentum are related but distinct investment factors. Growth stocks are selected based on fundamental earnings and revenue characteristics — the quality of business performance. Momentum stocks are selected based on recent price performance — they have been going up and are expected to continue. Many growth stocks are also high momentum, but you can have momentum in a non-growth stock (a beaten-down value stock that starts recovering), and you can have low-momentum growth (a strong-growing company whose stock has stalled).
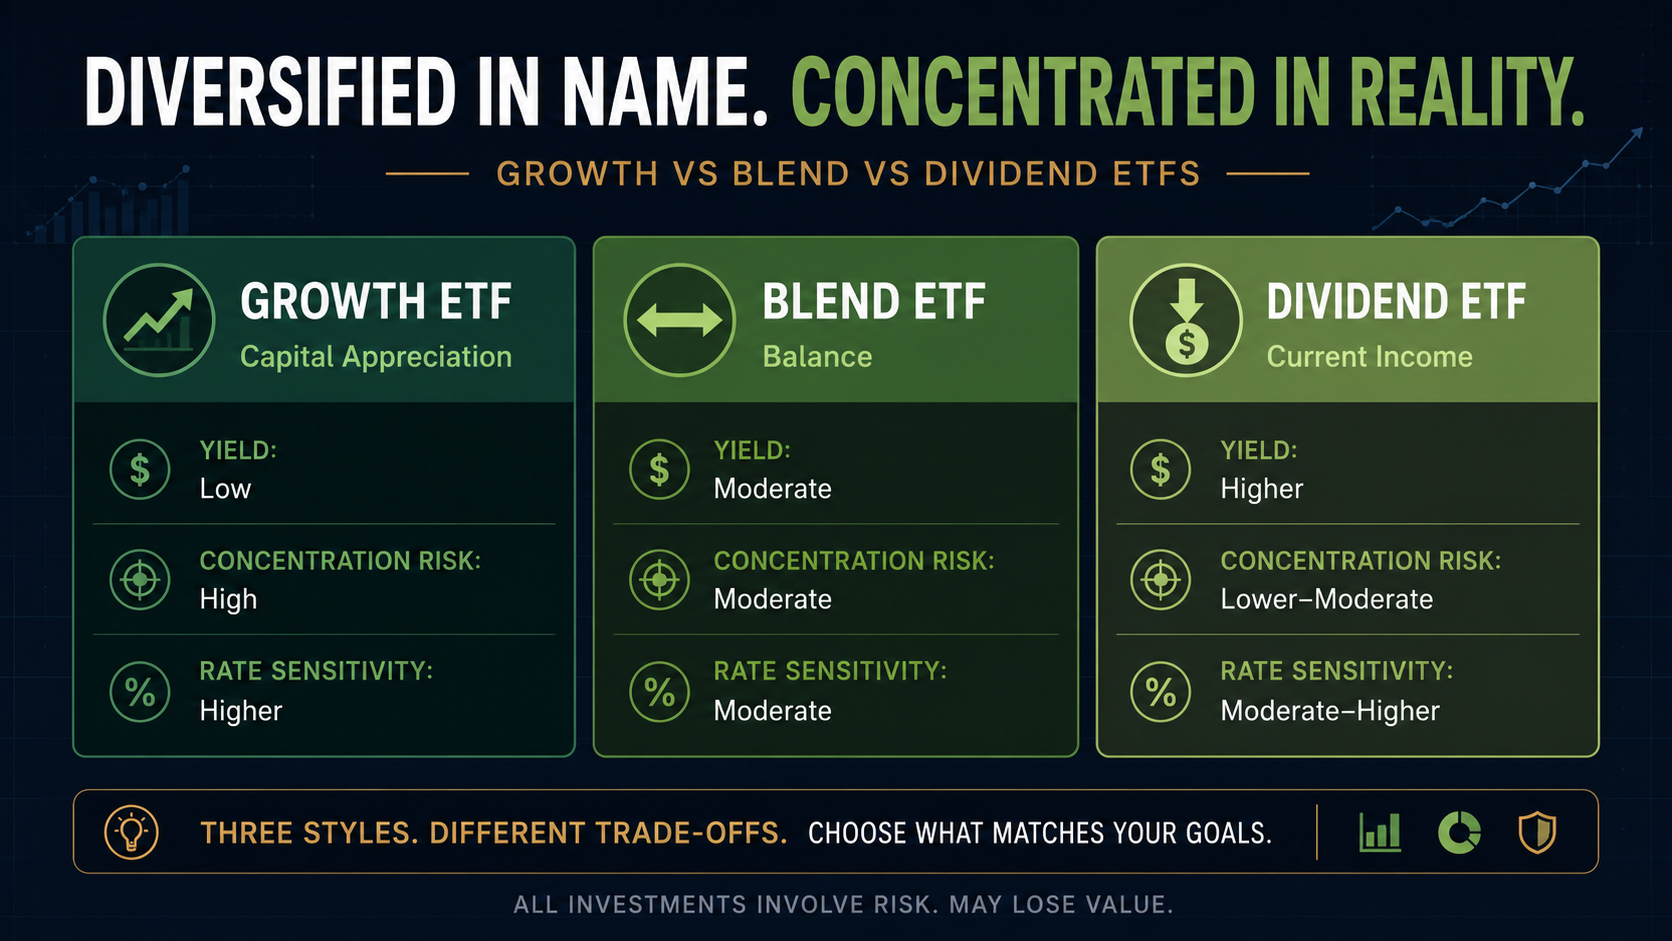
Growth vs Value vs Blend: Understanding the Style Box
Every equity ETF sits somewhere on the style spectrum from growth to value, and from large cap to small cap. Understanding where a growth ETF sits — and how that position changes performance across market cycles — is the foundation for using them intelligently.
Growth: High Expectations, High Multiples
Growth stocks trade at premium valuations because investors expect future earnings to justify today’s price. A technology company with a P/E of 35 may be ‘cheap’ on a growth-adjusted basis if its earnings are growing 40% per year. The risk: if growth decelerates or rates rise (reducing the present value of those future earnings), the premium multiple contracts and the stock falls sharply.
Value: Low Multiples, Near-Term Earnings
Value stocks trade below their assessed intrinsic value — low P/E, low P/B, often in cyclical or mature industries. They produce more immediate earnings and typically pay higher dividends. Value stocks are less sensitive to interest rate increases because their earnings are near-term, not discounted decades forward.
The 2009–2021 Growth Dominance
Near-zero Federal Reserve rates from 2009 to 2022 created ideal conditions for growth stock outperformance: low discount rates maximised the present value of growth companies’ distant future earnings; technology sector profit growth was exceptional; and the digital economy transition created secular tailwinds. The Russell 1000 Growth substantially outperformed the Russell 1000 Value for most of this period.
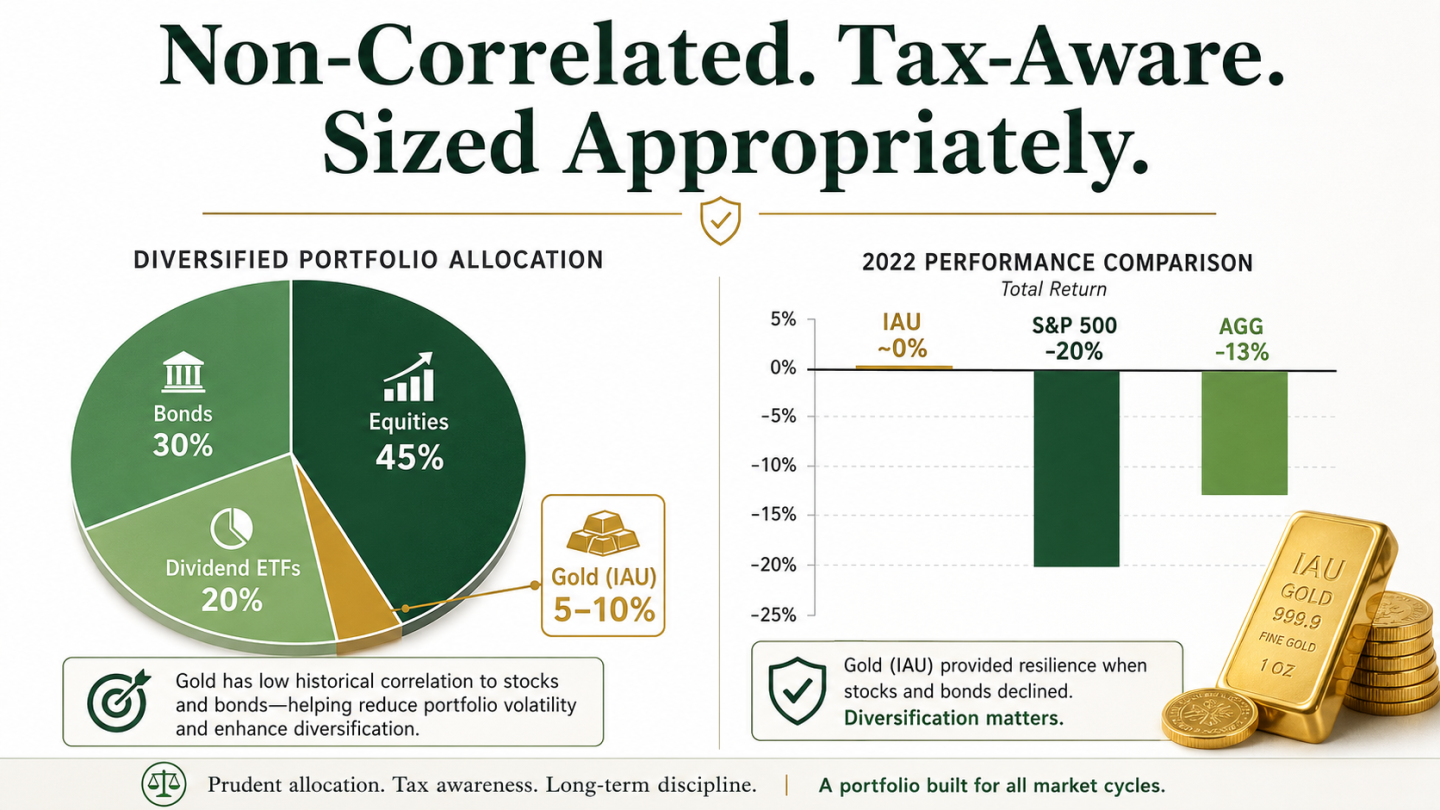
The 2022 Reversal: The Rate Mechanism in Action
When the Federal Reserve raised rates from near-zero to approximately 5%+ in 12 months, the present value of growth companies’ distant future earnings fell sharply — the discount rate applied to them rose dramatically. The Russell 1000 Growth index declined approximately 29% in 2022; the Russell 1000 Value declined approximately 8%. A gap of approximately 21 percentage points in a single year — the largest single-year value outperformance in decades. Total market ETF holders experienced the weighted average of both.
The Major Growth ETFs: VUG, SCHG, SPYG, QQQ, QQQM, and IWF
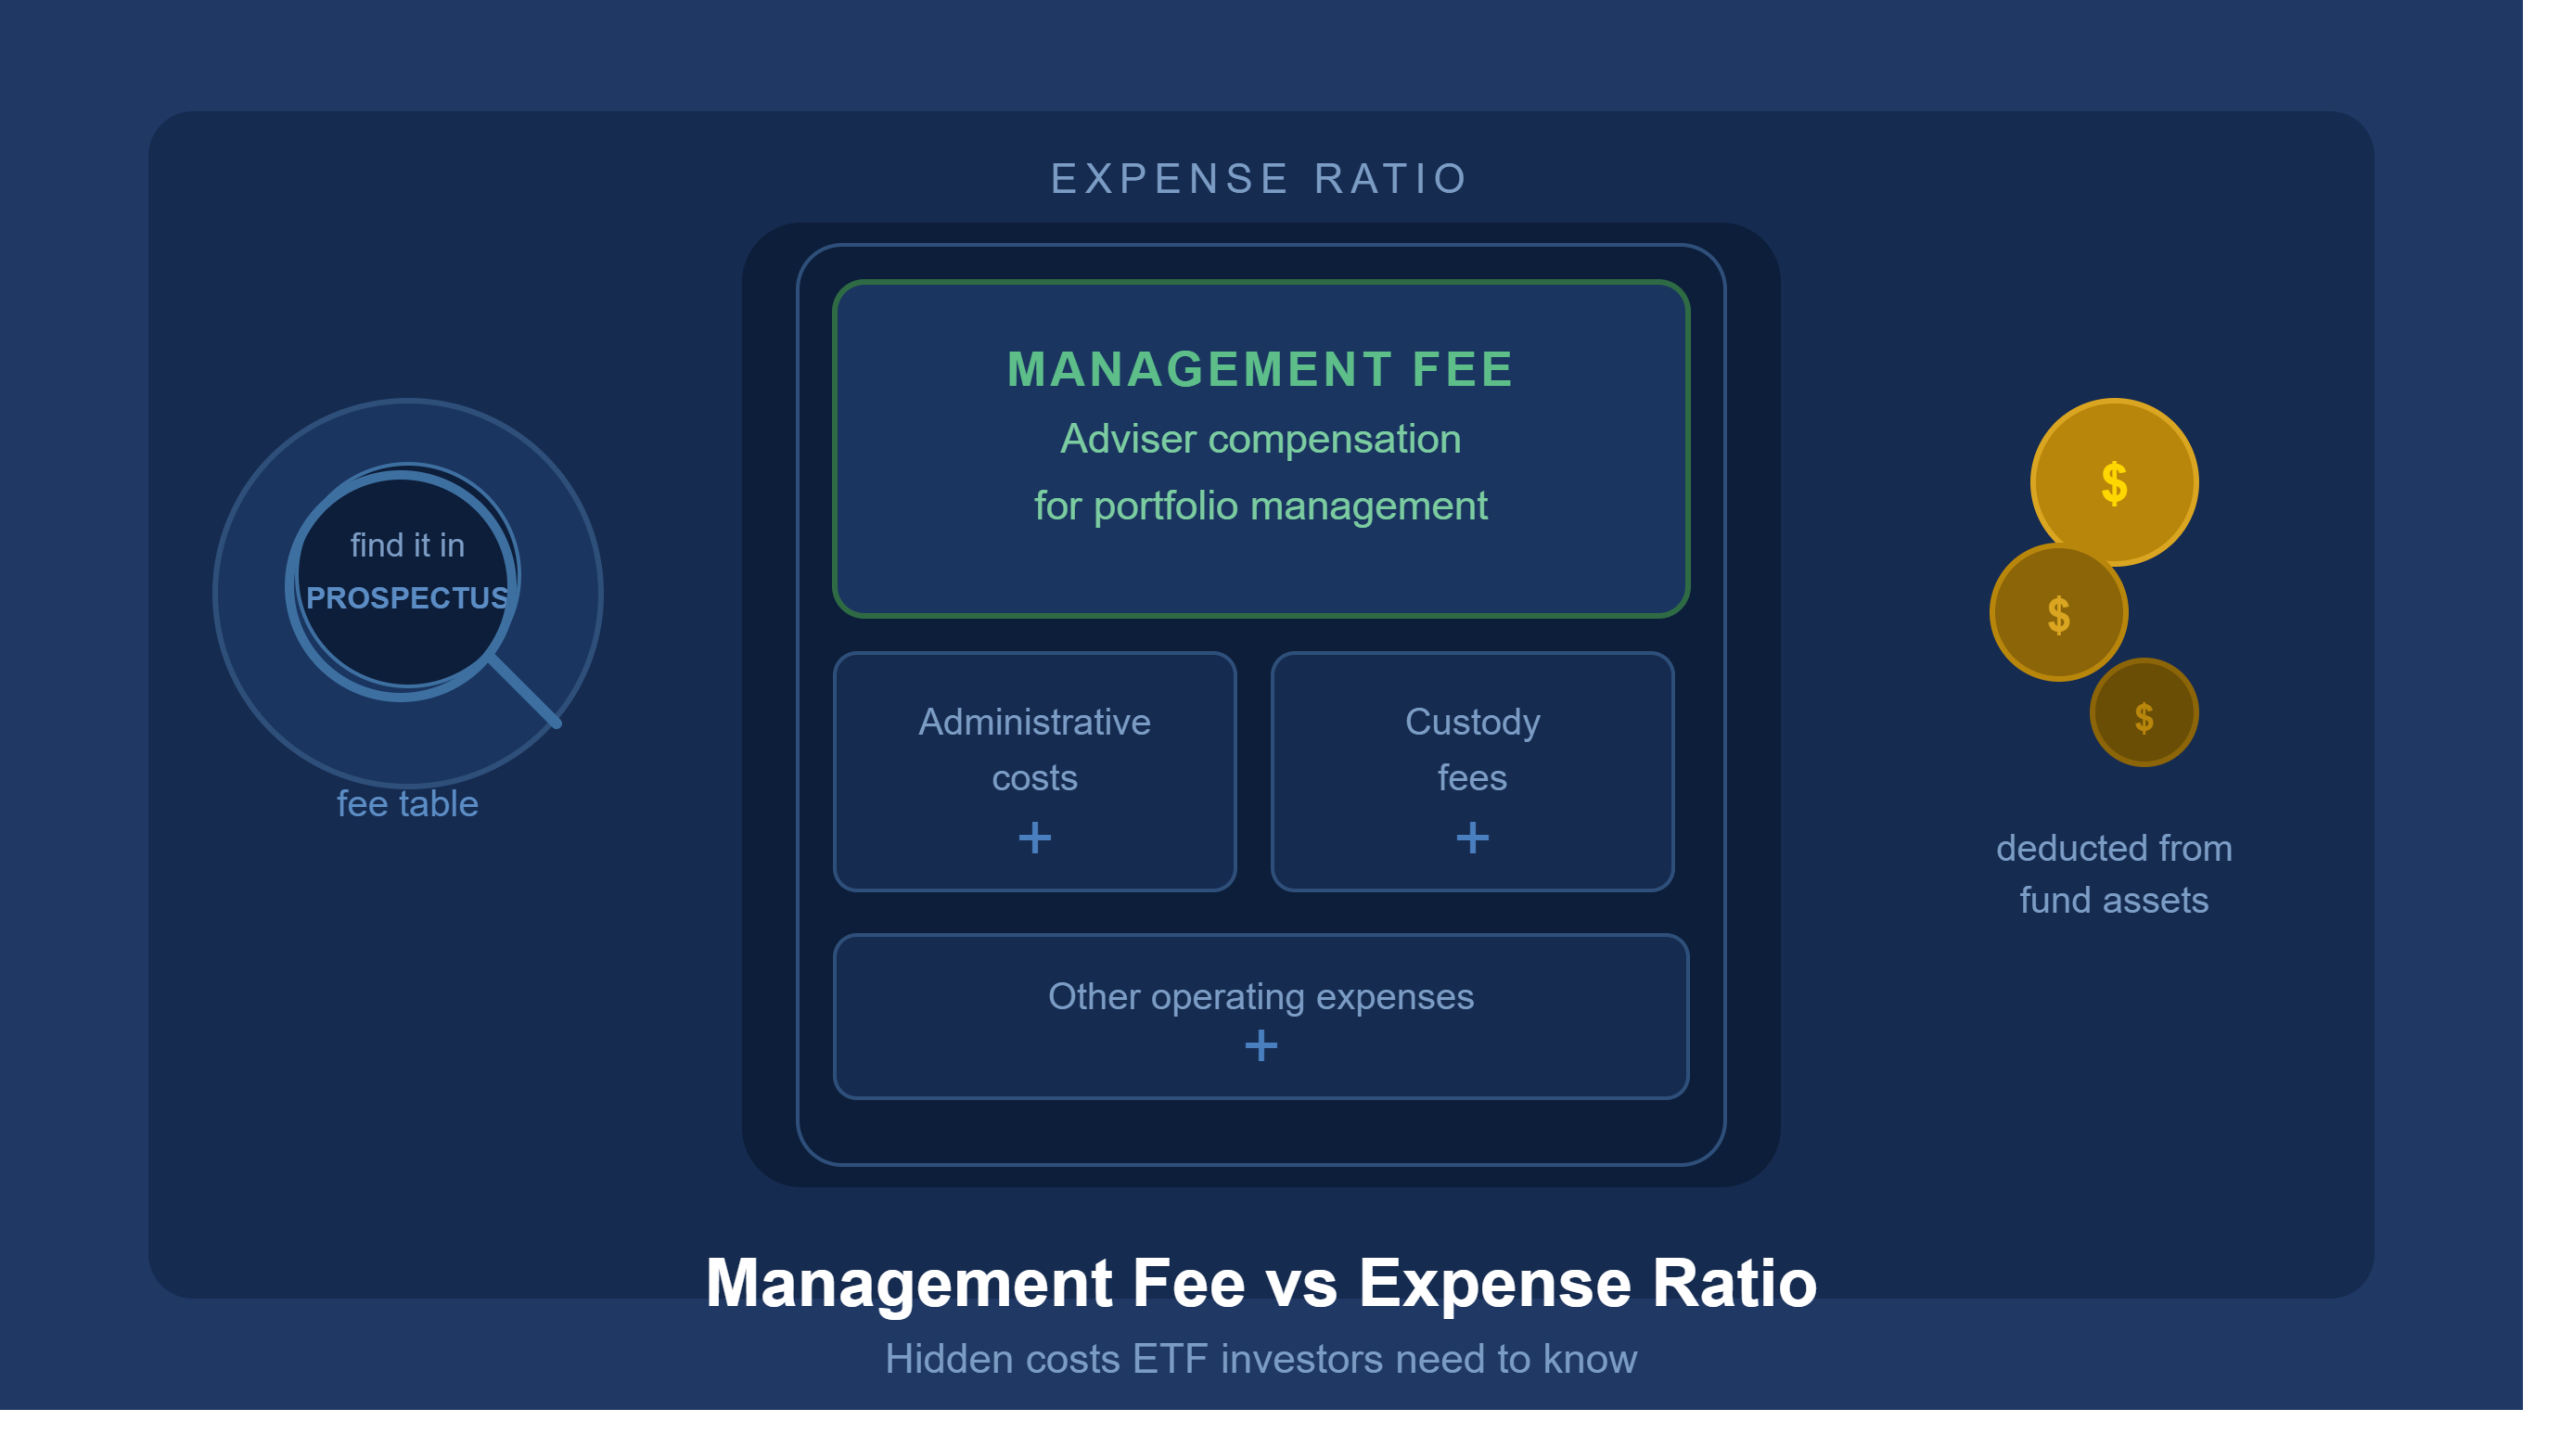
| Verify Before Investing
All expense ratios and fund characteristics are approximate and require verification at fund provider websites (Vanguard, Schwab, iShares, Invesco) before investing. |
Six funds dominate the growth ETF market. The most important structural distinction: VUG, SCHG, SPYG, and IWF are genuine growth factor-screened index funds. QQQ and QQQM are Nasdaq-100 index funds that behave like growth ETFs — but use a fundamentally different selection methodology.
| Ticker | Name | Index | Approx. ER | Holdings | Key Characteristic |
|---|---|---|---|---|---|
| VUG | Vanguard Growth | CRSP U.S. Large Cap Growth | ~0.04% | ~230 | Lowest cost; most widely held pure growth ETF |
| SCHG | Schwab Large-Cap Growth | DJ U.S. Large-Cap Growth | ~0.04% | ~260 | Near-identical to VUG; slightly more holdings |
| SPYG | SPDR S&P 500 Growth | S&P 500 Growth Index | ~0.04% | ~230 | Growth portion of S&P 500 only |
| QQQ | Invesco QQQ | Nasdaq-100 (by mkt cap) | ~0.20% | 100 | Deepest options market; NOT a growth index |
| QQQM | Invesco QQQM | Nasdaq-100 (by mkt cap) | ~0.15% | 100 | Same as QQQ; lower cost; less liquid |
| IWF | iShares Russell 1000 Growth | Russell 1000 Growth | ~0.19% | ~500 | Broadest holding count; includes smaller large-caps |
The QQQ Question: Growth ETF or Technology ETF?
QQQ and QQQM track the Nasdaq-100 — the 100 largest non-financial companies listed on the Nasdaq exchange, selected by market capitalisation, not growth factors. A slow-growing company can be in the Nasdaq-100 if it is large enough. QQQ is effectively a large-cap technology and technology-adjacent index fund — it behaves like a growth ETF because the biggest Nasdaq-listed companies happen to be technology-oriented, not because it screens for growth characteristics.
The practical distinction: VUG is diversified across all growth sectors; QQQ is concentrated in Nasdaq-listed companies, which skews heavily toward technology and technology-adjacent (Apple, Microsoft, Nvidia, Amazon, Meta, Alphabet). QQQ is not interchangeable with VUG for investors who want broadly defined growth exposure.
QQQM vs QQQ: Same Index, Lower Cost
QQQM was launched in 2020 specifically for retail buy-and-hold investors. It tracks the identical Nasdaq-100 index at a lower expense ratio (~0.15% vs QQQ’s ~0.20%). The trade-off: QQQ has far greater liquidity and the deepest equity ETF options market in the world — essential for active traders using QQQ for tactical positioning or options strategies. Long-term buy-and-hold investors save on costs with QQQM; active traders need QQQ’s liquidity.
Technology Concentration: What You’re Really Buying
| The Concentration Reality
The headline holding count of a growth ETF overstates its diversification. In VUG, the top 10 holdings typically represent approximately 48-55% of total fund value. In QQQ, the top 10 can represent 55-60%. The remaining 220+ holdings collectively represent less than half the portfolio. Owning a growth ETF is largely equivalent to owning the top 10 technology and technology-adjacent mega-cap companies. |
How Market-Cap Weighting Creates Concentration
All major growth ETFs weight their holdings by market capitalization — the largest companies receive the largest weights. Apple, Microsoft, Nvidia, Amazon, Alphabet, and Meta are simultaneously the largest companies by market cap AND among the highest-scoring on growth factor metrics. They therefore dominate every large-cap growth index, regardless of whether the fund holds 100 or 500 names.
Technology Sector Weight
Technology sector exposure in major growth ETFs typically ranges from 40-50% of fund value. Adding communication services (which includes Alphabet and Meta) and consumer discretionary (which includes Amazon) brings combined ‘technology and technology-adjacent’ exposure to approximately 60-65% or more in some growth ETFs. A ‘diversified’ growth ETF is primarily a technology allocation with other sectors filling the remaining weight.
The SPY + VUG Overlap Problem
An investor who holds SPY (S&P 500, approximately 30-35% technology by weight) alongside VUG (approximately 45% technology) may believe they are diversifying across the broad market and specifically into growth. In practice, both funds are heavily weighted toward the same handful of technology mega-caps. Adding VUG on top of SPY does not diversify away from technology — it increases the aggregate technology concentration significantly.
If technology sector exposure is the intended position, owning it deliberately through sector ETFs (XLK, QQQ) is more honest than owning ‘diversified’ funds that happen to be technology-dominated.
The Single-Stock Concentration Risk
When a top holding in a growth ETF falls sharply — as Apple fell approximately 27% in 2022 and Nvidia has experienced multiple 30-40% corrections through its history — every large-cap growth ETF falls proportionally to that company’s weight. Investors who believe their growth ETF is broadly diversified may not realise they are effectively running a multi-percentage-point concentrated single-stock bet in each of their top 5-10 holdings.
Growth ETFs vs Dividend ETFs: The Return Composition Trade-Off
Growth ETFs and dividend ETFs represent opposite ends of the equity return spectrum. Understanding the difference determines which is appropriate for a given investor at a given stage.
Return Composition
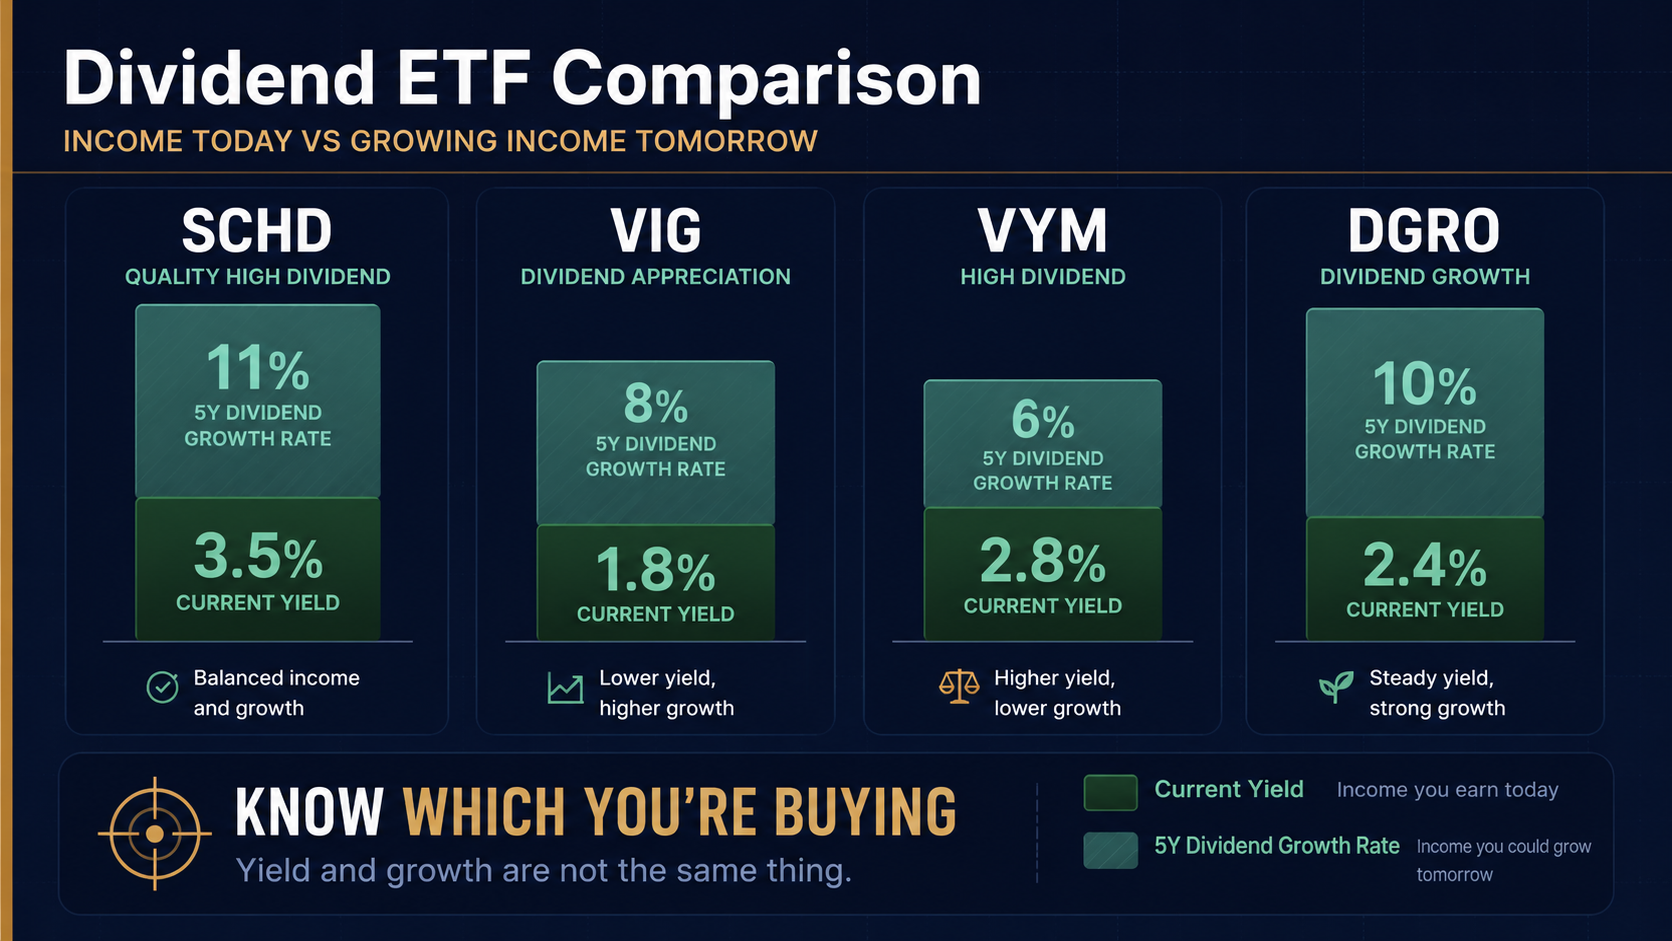
Growth ETF (VUG): dividend yield approximately 0.5-0.7%; almost all return comes from price appreciation. Dividend ETF (SCHD): dividend yield approximately 3-4%; meaningful income plus moderate price appreciation. Over a long period, their total returns (price plus dividends reinvested) can converge — but the path, timing, and tax treatment differ significantly.
The Tax Efficiency Advantage of Growth ETFs
Growth ETFs generate minimal annual taxable income — the low dividend yield means very few tax events occur while holding. Capital gains compound inside the ETF without forced annual distribution. Taxes are deferred until the investor sells, at which point they pay long-term capital gains rates if held for more than one year. This makes growth ETFs among the most tax-efficient equity investments available in taxable accounts.
Dividend ETFs, by contrast, generate regular taxable distributions (even if primarily qualified) in the year received. The investor pays taxes on each year’s dividends regardless of whether they need the income.
Interest Rate Sensitivity: Growth Loses; Income Holds
Growth ETFs are significantly more sensitive to rising interest rates than dividend ETFs — particularly dividend growth ETFs. The mechanism: growth stocks’ valuations rest on distant future earnings, which are more heavily discounted as rates rise; dividend growth companies tend to have more immediate, stable earnings. In the 2022 rate-hiking cycle, growth ETFs fell roughly 3-4x more than dividend growth ETFs.
When Growth ETFs Outperform — and When They Don’t
Growth ETFs are not all-weather performers. Knowing the conditions that drive outperformance and underperformance allows investors to hold them with appropriate expectations.
Conditions That Favour Growth ETFs
- Low or declining interest rates: reduces discount rate on future earnings, increasing present value of growth stock cash flows
- Economic expansion: rising corporate revenues confirm growth stock valuations; earnings meet or beat expectations
- Technology and innovation cycles: transformational technology adoption (internet era, mobile era, AI era) produces secular growth that carries growth ETFs for extended periods
- Low inflation: stable prices maintain profit margins without forcing monetary tightening
Conditions That Hurt Growth ETFs
- Rising interest rates: the primary growth ETF adversary (the 2022 example: Growth -29%, Value -8%)
- High inflation requiring monetary tightening: forces rate hikes that reduce growth stock valuations
- Value rotation: institutional rotation from growth into lower-multiple value and commodity sectors in late-cycle environments
- Technology-specific regulatory or earnings disappointments: high concentration means sector-specific events have outsized impact
The Long-Run Track Record
Despite severe cyclical drawdowns (2000-2002, 2022), large-cap growth ETFs have delivered strong long-run total returns for patient investors. The key: the periods of severe underperformance are time-limited and followed by recoveries that reward investors who did not sell at the bottom. Growth ETFs reward long time horizons (10+ years) and punish short ones.
Building a Portfolio With Growth ETFs
Growth ETFs serve a specific function in a well-constructed portfolio — and that function changes with the investor’s phase and risk tolerance.
The Accumulation Phase: Growth as the Core Engine
For investors with 10+ year time horizons who do not need current income, a growth ETF core (VUG or SCHG) or a growth-tilted total market allocation provides the return engine for wealth building. The high price appreciation potential, tax efficiency, and historical long-run performance record make growth ETFs the appropriate core for patient accumulation-phase investors who can psychologically tolerate 30-40% drawdowns in adverse cycles.
Total Market Core + Growth Tilt
A more moderate approach: total market ETF core (VTI, 70-80% of equity allocation) for cycle-neutral broad market exposure, plus growth ETF satellite (VUG or SCHG, 20-30%) for an intentional growth tilt. This accepts the full market return as the foundation and adds deliberate growth-factor exposure without abandoning value and blend allocation entirely.
The VUG + SCHD Pairing
Pairing a growth ETF (VUG, ~0.5-0.7% yield, appreciation-focused) with a dividend ETF (SCHD, ~3-4% yield, income-focused) creates a portfolio with both capital appreciation and current income. The combination reduces pure interest-rate sensitivity while maintaining growth exposure. A 60% VUG / 40% SCHD blended allocation delivers a ~1.7% blended yield with significantly higher growth potential than a pure dividend portfolio.
QQQ for Active Traders
QQQ is the most traded equity ETF in the world and has the deepest options market of any equity instrument. Active traders use QQQ for: tactical growth/technology directional positions, swing trading on technical setups (VWAP above/below, 9 EMA and 20 EMA alignment, MACD momentum confirmation), and options day trading as covered in ATGL’s day trading options content. For active satellite allocation, QQQ provides the liquidity, chart precision, and options chain depth that smaller or less liquid ETFs cannot.
Avoiding the Concentration Trap
Before adding a growth ETF alongside existing holdings, calculate aggregate technology sector exposure across all positions. If SPY (30-35% tech) + VUG (45% tech) + QQQ (50%+ tech) are all held simultaneously, the portfolio may have 40%+ effective technology exposure despite appearing diversified across multiple funds.
Own Growth ETFs Deliberately — Not by Default
Growth ETFs are powerful long-run compounding vehicles — and importantly concentrated technology sector positions dressed in the language of diversification. Both things are true simultaneously.
The framework:
- VUG and SCHG: the most cost-efficient pure growth ETFs at ~0.04% ER; genuinely growth factor-screened across sectors
- QQQ and QQQM: Nasdaq-100 index funds — technology/large-cap concentration, not growth screening; QQQ for active traders (deepest options market), QQQM for long-term holders (lower cost)
- Top-10 concentration: VUG top 10 = ~48-55% of fund; QQQ top 10 = ~55-60%; the headline holding count overstates diversification
- Technology weight: approximately 40-50% in VUG; add communication services and consumer discretionary for ~60-65%+ tech-adjacent exposure
- The SPY + VUG overlap: both are technology-dominated; adding VUG on top of SPY concentrates further, not diversifies
- Performance cycle: growth outperforms in low-rate expansion; underperforms when rates rise (2022 proved this at -29% vs value -8%)
- Tax efficiency: growth ETFs are among the most tax-efficient equity structures — minimal annual distributions, deferred capital gains
- Pairing strategy: VUG + SCHD for growth/income balance; total market core + growth ETF satellite for cycle-neutral base with growth tilt
| Trade and Build Around Growth ETFs With ATGL
At AboveTheGreenLine.com we give investors the complete framework for ETF selection, portfolio construction, and active trading — from the passive growth ETF core to the rules-based satellite strategies using QQQ for tactical growth exposure. Join us Above the Green Line. |
Frequently Asked Questions
What is the best growth ETF to buy?
VUG (Vanguard Growth ETF) and SCHG (Schwab U.S. Large-Cap Growth) are the most widely held pure growth index ETFs at approximately 0.04% expense ratio — the lowest cost in the category. Both track large-cap growth factor-screened indices with approximately 230-260 holdings. QQQ has the deepest options market and is preferred by active traders but carries a higher expense ratio (~0.20%) and is a Nasdaq-100 fund, not a growth-screened fund. Verify current expense ratios at fund provider websites.
Are growth ETFs riskier than index ETFs?
Growth ETFs carry more concentrated risk than a total market index ETF. A total market ETF includes growth, value, and blend stocks across all sectors. A growth ETF excludes value stocks and holds approximately 40-50% in technology. In rising rate environments (2022), growth ETFs can fall 30-40% while total market ETFs fall less. The additional risk is real and cyclical — it can be severe for periods of 1-3 years — but growth ETFs have historically recovered and produced strong long-run total returns for investors with 10+ year horizons.
Is QQQ a growth ETF?
QQQ is often treated as a growth ETF but technically tracks the Nasdaq-100 — the 100 largest non-financial Nasdaq-listed companies selected by market capitalisation, not growth factors. It behaves like a growth ETF because the largest Nasdaq companies are predominantly technology-oriented. VUG and SCHG are genuinely growth factor-screened; QQQ is a concentrated large-cap technology and technology-adjacent index fund. For active traders, QQQ offers the deepest equity ETF options market. For long-term buy-and-hold investors seeking pure growth factor exposure, VUG or SCHG are more accurate choices.
What is the difference between growth ETFs and dividend ETFs?
Growth ETFs (VUG, SCHG) prioritise capital appreciation — they hold companies that reinvest earnings rather than pay dividends; current yield is approximately 0.5-0.7%. Dividend ETFs (SCHD, VIG) prioritise income — current yield 2.0-4.5%, with lower price appreciation emphasis. Over long periods, total returns can converge, but growth ETFs are more tax-efficient (minimal annual taxable distributions), more interest-rate sensitive (fell ~29% in 2022 vs dividend ETFs -8-12%), and suit accumulation-phase investors with long time horizons. The VUG + SCHD combination balances both approaches.

Related Articles
[pt_view id=”fb2451fm3r”]