
The Top Pick of the Week System is up +104 %, vs the S&P 500 up +21 % (since the Oct. 7, 2024 inception).
For busy investors that don’t have time to Swing Trade, we now have a simple Strategy:
Top Pick of the Week. You Buy the “Pick” on Monday morning, and then Sell on Friday’s Close. It’s a time-efficient approach designed to capture short-term gains without requiring constant market monitoring.
This “Pick” is emailed to you with this Weekly Commentary (see below & more details here).
The Top Pick of the Week is: Intel Corp. $INTC to Buy on the Open on Monday, and Sell on the Close Friday.
You can view the current Weekly Stock Performance.
______________________________________________________________________________
DAILY SWING TRADING (SHORT TERM)Watch List and Charts to Buy Soon.
| Daily Swing Watch List to Buy | Daily Swing Charts to Buy |
| Current Daily Swing Positions | Current Swing Charts |
| Closed Daily Swing Results | Trading Dashboard |
12/14/2025 Markets were mixed for the week as the Indices and Leaders struggled after retesting the recent Highs. The FED Cut short term Rates again on Wednesday, which should add liquidity to the Economy. The DOW 30, NYSE, & Small Caps made higher highs.
But Bonds dropped as liquidity normally adds to Inflation, and long term Rates actually went up. There is a Cost to FED Printing, but the Tangible ETFs (Steel, Copper, and Silver) made new highs this week. (Tangibles normally do well with Inflation).
The major Indices are back up near the highs, and must make higher highs soon for this huge rally from the April lows to continue. Otherwise this could be a Double Top (M pattern) and a Sell signal for many Technical Analysts.
We Buy the strongest Leaders that make new highs, on pull-backs. So follow the Green Line System and you should continue to win more than you lose. SEE WATCH LIST
With the Green Line System, your Money should flow into the Strongest areas and your Account value should be able to grow in both Bull and Bear Markets. Follow the MONEY, not the MEDIA.
______________________________________________________________________________
For the week the Dow was up 1.12%, the S&P 500 was down 0.63% and the NASDAQ 100 was down 1.90%. The major Indices still have a Relative Strength below 80, so you should currently own the stronger Funds here.
The Inflation Index (CRB) was down 2.51% this week and is Above the Green Line, indicating Economic Expansion.
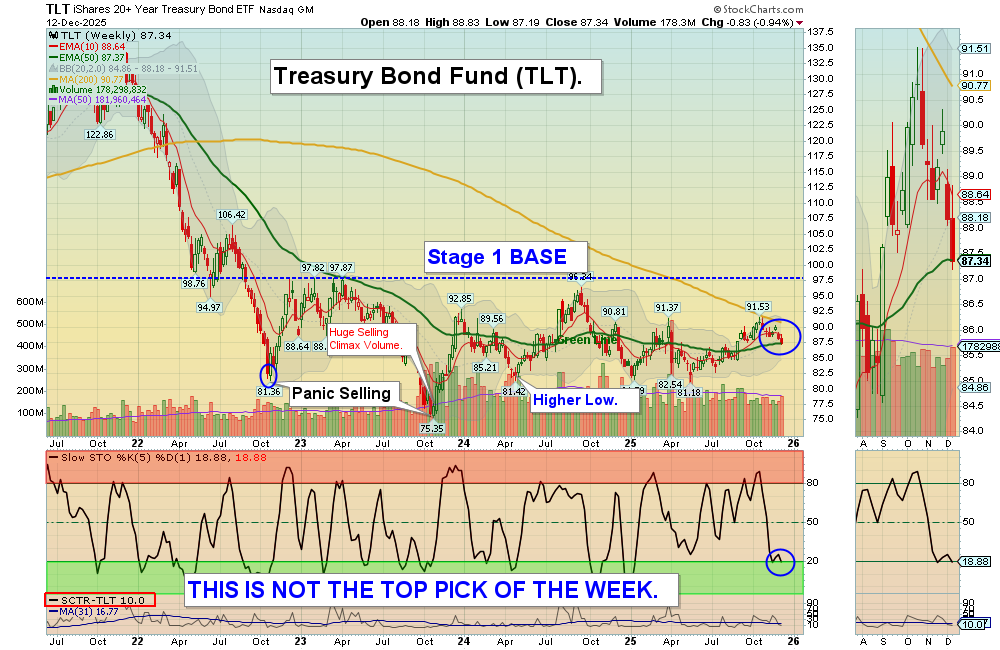
Bonds were down 0.94% for the week, and are Below the Green Line, indicating Economic Expansion.
The US DOLLAR was down 0.61% for the week.
Crude Oil was down 4.24 % for the week at $57.53 and GOLD was up 2.34% at $4297.29.
_______________________________________________________________________
DAY TRADERS: We are doing many profitable Day Trades at our Live Trading Room on YouTube during Market hours. Please join Discord or X (Twitter) with your cell phone app for the fastest Trade Alerts and Daily email notifications during the day. Other methods of notification have been too slow.
_______________________________________________________________________
COMPLETED DAILY SWING TRADE TRADES:
MU Micron Tech. Target was Hit at $249 with an 11.2% Gain.
NGD New Gold Inc. Target was Hit at $8.30 with a 6% Gain.
NVTS Navitas Semi. Sold via Trade Alert at $10. for a 9.65 % Gain.
W WayFair Inc. Sold via Trade Alert at $100.50. for a 6.7 % Gain.
FNMA Fed. Nat’l. Mtg. Stopped Out with a – 19 % Loss.
IVVD & SNDK Slipped down to the Buy Price, and were stopped out even.
We are now in 1 Three Star logged Swing Trading Position for the Short Term. There are 2 investments on the Short Term Watch List.
Completed Swing Trades thru Nov 2025: 231 Trades, or 3.2% Avg. / Trade (before taxes and commissions).
______________________________________________________________________________
WEEKLY SWING TRADES – WATCH LIST
| Open Date | Symbol | Description | Industry | SCTR | Size | Last Price | Daily Change % | ATGL 60 Min | Comments | id | Strategy | Position | Sell Date | Sell Price | Purchase Price | Net Profit | Realized Gain/Loss % | ATGL Rule | Stop Loss | color | Chart | Update Date | Status | Unrealized Gain/Loss % | Volume | Post Type | # Shares | Amount Invested | Portfolio Weight | Dividend Rate | Current Yield | Current Value | Yield on Cost | Projected Annual Dividends | Total Dividends Received | Pay Back | Profit / Loss | Annualized Profit/Loss | Star Rating | Target Price | News Alert % | Target Triggered |
|---|---|---|---|---|---|---|---|---|---|---|---|---|---|---|---|---|---|---|---|---|---|---|---|---|---|---|---|---|---|---|---|---|---|---|---|---|---|---|---|---|---|---|
| 2026-06-17 | USO | US Oil Fund | Energy | 92 | ETF | $114.28 | -0.5136 | Wait for next Weekly Money Wave Close > 20 with High Volume. | 5092 | Long Term | Long | $0.00 | 0.00% | https://stockcharts.com/sc3/ui/?s=USO&a=2293225295&p=W&yr=1&mn=6&dy=0&id=p78387113253 | 2026-06-18 15:54:20 | open | 0.00% | 0 | Watch List | $0 | 0.00% | 0.00 | 0 | $0 | 0.00% | $0 | $0 | 0.00% | 0.00% | - | $135.00 | |||||||||||
| 2026-06-07 | SLV | Silver Fund | Metals | 93 | ETF | $59.05 | -0.773 | Wait for next Weekly Money Wave Close > 20 with High Volume. | 5083 | Long Term | Long | $0.00 | 0.00% | https://stockcharts.com/sc3/ui/?s=SLV&a=2284537971&p=W&yr=1&mn=6&dy=0&id=p52385594523 | 2026-06-08 19:47:29 | open | 0.00% | 0 | Watch List | $0 | 0.00% | 0.00 | 0 | $0 | 0.00% | $0 | $0 | 0.00% | 0.00% | - | $80.00 | |||||||||||
| 2026-05-26 | CTMX | Cytomx Thera. | HealthCare | 83 | Small | $2.96 | 0.1695 | Wait for next Weekly Money Wave Close > 20 with High Volume. | 5071 | Long Term | Long | $0.00 | 0.00% | https://stockcharts.com/sc3/ui/?s=CTMX&a=2273899296&p=W&yr=1&mn=0&dy=0&id=p89336138870 | 2026-05-26 19:08:23 | open | 0.00% | 0 | Watch List | $0 | 0.00% | 0.00 | 0 | $0 | 0.00% | $0 | $0 | 0.00% | 0.00% | - | $5.50 |
Weekly Green Zone Pops – Click here for scrolling charts.
WEEKLY SWING TRADES
NET Cloudflare Inc. Weekly Swing Trade Buy. Target is $238.
PLTR Palantir Inc. Target was Hit at $190 with a 14.6% Gain.
Completed Weekly Swing Trades thru Nov 2025: 41 Trades, or 16.3 % / Trade (before taxes & commissions).
______________________________________________________________________________
Important Links| Top 100 | Stage Chart Investing | CNN Fear & Greed Index |
| Dividend Growth Portfolio | ETF Sector Portfolio | Dogs of the Dow |
| Long Term Strategy | Stage Chart Investing | Articles |
Alert! Market Risk is Medium (Yellow). The probability of successful Short Term Trades is better, when the % of stocks above the 50-day avg. is below 20.
Tell your Friends about the Green Line, and Help Animals.
______________________________________________________________________________
QUESTION: Jackie writes “Been reading your informative articles and FAQs. Is there a way I can enter a stock such as WMT or an ETF symbols and see them shown as AGL chart with red/green zones, MAs, sector ranking, Green Line etc?”
ANSWER: Yes. Near the bottom of each Daily email, look for: ARE YOUR INVESTMENTS ABOVE THE GREEN LINE?
Please Click on the link (To make the Chart larger, please change the SIZE to Landscape and then Update.)
Good trading and tell your friends!
ATGL
