Above the Green Line -01
  • Market Insights
        • Commentary
          • Daily
          • Weekly
        • BUY / SELL SIGNALS
          • Trade Posts
          • Recent Trade Alerts
          • Recent Day Trades
        • BLOGROLL
          • Dividend Growth Blog
          • ETF Sector Blog
          • Dow Dogs
          • TPOW Blog
  • Strategies
        • SWING TRADING
          • Current Positions
          • Watchlists
          • Closed Positions
          • Candidates - TOP 100
          • Specialty Stocks
        • WEEKLY STOCK PICK
          • TPOW Charts
          • TPOW Performance
          • TPOW Strategy Guide
          • TPOW Performance Dashboard
        • DAY TRADING
          • Watch List
        • ATGL DASHBOARD
        • ETF STRATEGIES
          • ETF Sector Rotation
          • ETF Sector Portfolio
        • DIVIDEND GROWTH
          • Dividend Growth Portfolio
          • Dividend Calendar
        • DOGS OF THE DOW
          • Dogs of the Dow Portfolio
          • DOW 5 Portfolio
  • Markets
        • US MARKET
          • Commodities
          • Energy
          • Precious Metals
          • Volatility
        • GLOBAL MARKETS
          • Market Indices
          • Economic Calendar
          • FOREX Heat Map
          • FOREX Cross Rates
          • Crypto Currency Market
  • Investing
    • Discord Community
    • Dashboard
  • Resources
        • ARTICLES
          • Dividend Growth Model Articles
          • ETF Articles
          • Investment Strategies Articles
          • Market and Economic Insights
          • Stock Trade Articles
          • Stock Reviews
        • TOOLS
          • Stock Scanners
          • Charting Software
          • Brokerage Firms
        • STOCK CHARTS
          • Key Components
          • Reading Charts
          • Drawing Stock Charts
          • Identifying Trends
        • RETIREMENT PLANNING
  • About
    • Contact Us
    • How to Win
    • #1 At Stockcharts
    • Disclaimer
    • FAQ
  • Log In
  • Subscribe

March 18, 2021

Money Wave Alert! Mar 18, 2021

QQQ Chart
The weaker NASDAQ 100 Fund is below the Red Line, while the DOW 30 Index made a High today.

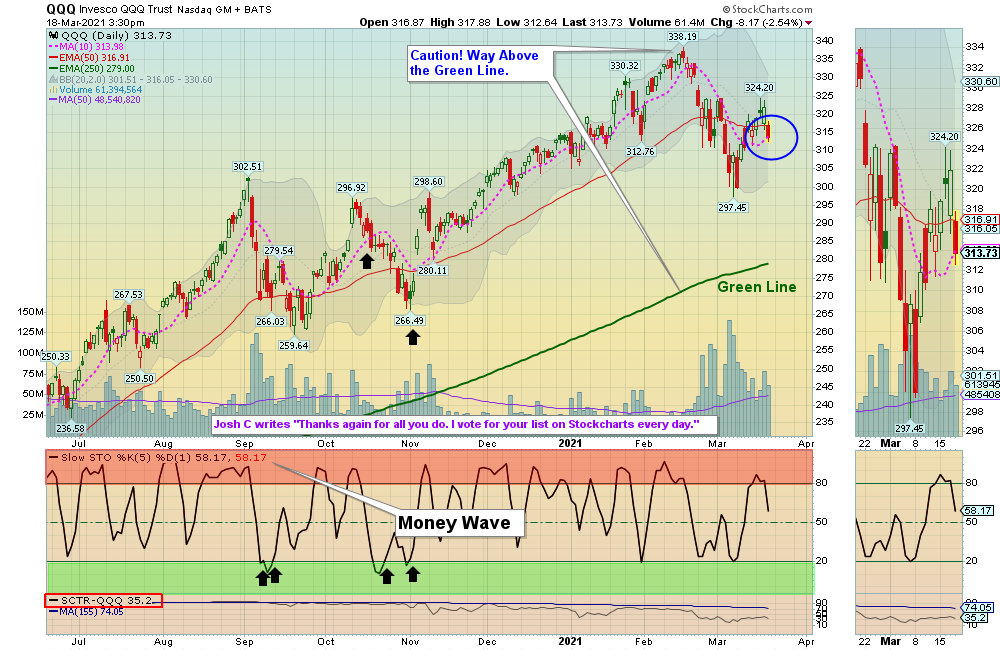
Markets were mostly lower today as the Big Tech Stocks dumped. The Market does not seem to have much New Money to Buy up at these levels, and the Money Wave Buy Signal Pops have been weak recently. We will probably Stop Out of several Positions today (see SELLS TODAY below).

The Stock Indices and almost all of the Leaders and Current Positions were back up near the Red Zones (probably too late to Buy for the Short Term.)  Currently the Watch List is small and mostly Oil Stocks, which says CAUTION. Now is the time to use discipline, and WAIT for Green Zone Buy Signals. It does not take that long. The better trades happen when the S&P 500 Index is also in the Green Zone  (now back up in the Red Zone). 

More news ones on the DAY TRADING SETUPS.

Bonds  were down again today, and are below the Green Line.

Crude Oil was down $5.83 today at $58.77.

BUYS TODAY    3/18/2021   NONE TODAY

JUMP START: (Buy Signal should be very soon… Click on the Jump Start link for more info.)   

MRO      MARATHON OIL          Buy above $11.85 with High Volume with a 5% Trailing Sell Stop Loss below it.

____________________________________________________________________________________________________________

WATCH LIST

WATCH LIST SCROLLING CHARTS (Real Time)     

CLR      CONTINENTAL RESOURCES      

FSR      FISKER INC.      

FUTU      FUTU HOLDINGS ADR

GT      GOODYEAR TIRE      Money Wave must Close in the Green Zone.           

OXY      OCCIDENTAL PETE.         

RIG      TRANSOCEAN INC.

Please be patient and wait for Money Wave Buy Signals.  We will email you when they are ready. Follow on the WATCH LIST.
Emotions are very high now, so please do not Buy unless you are VERY NIMBLE.

The Leaders are Way Above the Green Lines (all Investments eventually return to their Green Lines).

____________________________________________________________________________________________________________

SELLS TODAY  

APPS      DIGITAL TURBINE      EXIT if it is going to Close below the Pink Line around $78.23. This trade was not logged.

BNGO      BIANANO GENOMICS      EXIT if it is going to Close below the Pink Line around $8.80. This trade was not logged.

GE       GENERAL ELECTRIC      EXIT if it is going to Close below your Buy Price, or $13.35. This trade was not logged.

GEVO      GEVO INC.      EXIT if it is going to Close below your Buy Price, or $8.80. This trade was not logged.

PACB      PACIFIC BIOSCIENCES      EXIT if it is going to Close below the Pink Line around $32.51. This trade was not logged.

SNAP      SNAP INC.       EXIT if it is going to Close below the Pink Line around $59.29.  

TECK      TECK RESOURCES       EXIT if it is going to Close below the Pink Line around $21.80.  

VERU      VERU INC.      EXIT if it is going to Close below the Pink Line around $14.11. This trade was not logged.

Please update your Sell Stops.    

Click for  CURRENT POSITION CHARTS – Real Time  (Please check and adjust your Sell Stops).         
Click for  CLOSED POSITIONS,   
NEW:       MY TRADING DASHBOARD

DAY TRADING SETUPS
NEW:  TRADE ALERTS
ARE YOUR INVESTMENTS ABOVE THE GREEN LINE?
ETF SECTOR ROTATION SYSTEM   
TOP 100 LIST Updated Mar 1, 2021

Many like to Buy the day before, near the Close, if the Money Wave is going to create a Buy Signal (Closing > 20 and out of the Green Zone).

Don’t Buy if the Investment has already popped up too much. Money Wave Buys are usually good for a 3-6 %  move in a few days.

We will “Not Log” trades if the Reward/Risk is not at least 2:1.  These have more risk.   

Related Post

– Money Wave Alert! Mar 17, 2021

Subscribe to Our Newsletter

AGL Logo

Get our eBook Now!

Candlestick - A Swing Traders Friend

We don’t spam! Read our privacy policy for more info.

You’ve been successfully subscribed to our newsletter!

Voted #1 at Stock Charts

SH Chart
Inverse S&P 500 Fund (SH) will have a Money Wave Buy today.

Help Us Help Animals

Help Us Help Animals

Recent Comments

  • Market Breadth Indicators: A Trader’s Guide to Early Trend Detection on Backtesting: Definition and How a Trading Strategy Backtest Works
  • Island Reversal Pattern: Definition and Formation Explained on Double Top Pattern: How to Identify and Trade This Reversal Signal
  • Channel Pattern Guide: What It Is and Why It Matters on A Guide to Forecasting Using Moving Averages
  • What Is a Broadening Bottom Chart Pattern? Full Guide on Bull vs. Bear Market: An Investor’s Guide to Market Phases
  • ATGL Weekly Money Flow - 2025-05-11 on ATGL Top Pick of the Week! Apr 6, 2025

Become a Green Liner!

Help me make more Money in the Stock Market.

ON ATGL

  • DashBoard
  • Weekly Commentary
  • Daily Buy / Sell Signals
  • Day Trade Setup
  • Trading Rooms

Design & Develop By Pixelvect

STRATEGIES

  • Swing Trading
  • ATGL Pick of the Week
  • Dividend Growth
  • ETF Sector Rotation
  • Dogs of the Dow

HELP

  • ATGL Trading Rules
  • FAQ
  • Account Maintenance
  • Contact US
  • Join

FOLLOW US

Instagram Linkedin Twitter Facebook

© COPYRIGHT 2024 · ABOVETHEGREENLINE.COM · ALL RIGHTS RESERVED · PRIVACY · TERMS · CONTACT · WATCHLIST · CURRENT