Above the Green Line -01
  • Market Insights
        • Commentary
          • Daily
          • Weekly
        • BUY / SELL SIGNALS
          • Trade Posts
          • Recent Trade Alerts
          • Recent Day Trades
        • BLOGROLL
          • Dividend Growth Blog
          • ETF Sector Blog
          • Dow Dogs
          • TPOW Blog
  • Strategies
        • SWING TRADING
          • Current Positions
          • Watchlists
          • Closed Positions
          • Candidates - TOP 100
          • Specialty Stocks
        • WEEKLY STOCK PICK
          • TPOW Charts
          • TPOW Performance
          • TPOW Strategy Guide
          • TPOW Performance Dashboard
        • DAY TRADING
          • Watch List
        • ATGL DASHBOARD
        • ETF STRATEGIES
          • ETF Sector Rotation
          • ETF Sector Portfolio
        • DIVIDEND GROWTH
          • Dividend Growth Portfolio
          • Dividend Calendar
        • DOGS OF THE DOW
          • Dogs of the Dow Portfolio
          • DOW 5 Portfolio
  • Markets
        • US MARKET
          • Commodities
          • Energy
          • Precious Metals
          • Volatility
        • GLOBAL MARKETS
          • Market Indices
          • Economic Calendar
          • FOREX Heat Map
          • FOREX Cross Rates
          • Crypto Currency Market
  • Investing
    • Discord Community
    • Dashboard
  • Resources
        • ARTICLES
          • Dividend Growth Model Articles
          • ETF Articles
          • Investment Strategies Articles
          • Market and Economic Insights
          • Stock Trade Articles
          • Stock Reviews
        • TOOLS
          • Stock Scanners
          • Charting Software
          • Brokerage Firms
        • STOCK CHARTS
          • Key Components
          • Reading Charts
          • Drawing Stock Charts
          • Identifying Trends
        • RETIREMENT PLANNING
  • About
    • Contact Us
    • How to Win
    • #1 At Stockcharts
    • Disclaimer
    • FAQ
  • Log In
  • Subscribe

March 3, 2021

Money Wave Alert! Mar 3, 2021

TLT Chart
Bonds (TLT) are over-sold and could have a “W” pattern bounce soon.

Markets were mixed to lower today as some Big Tech and Momentum Stocks got hit hard. The DOW 30  and Small Cap Indices are holding up fine, but lots of profit taking on the Leaders. Money Wave Pops have been weak, and the Markets need more Stimulus to boost confidence. The Senate should vote soon on the Plan.

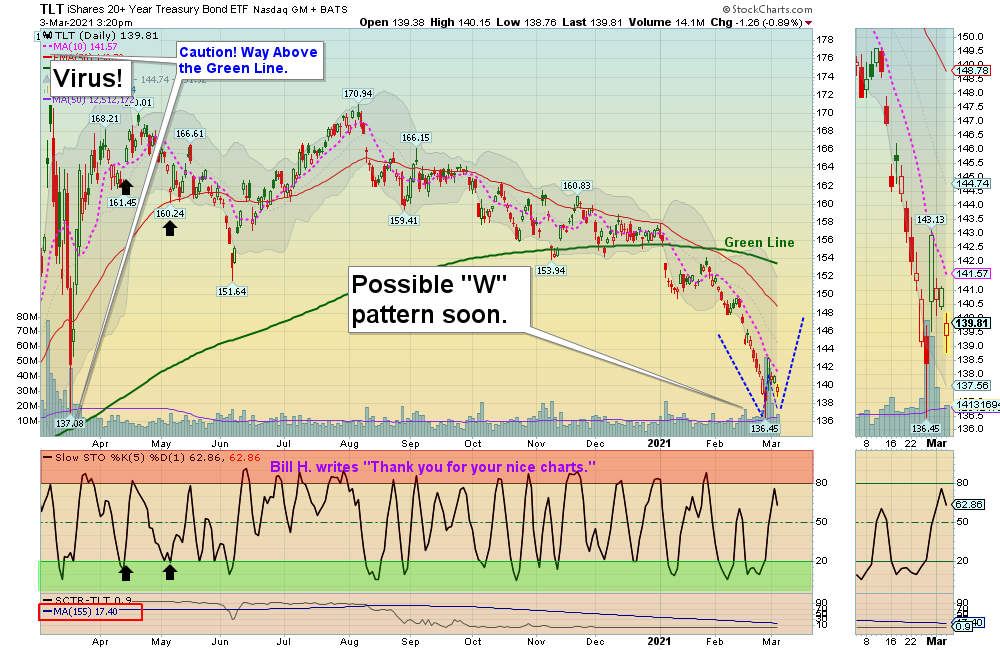
Soon the Indices need to make new Highs for the rally to continue. Bonds are very over-sold now and might be having a “W” pattern for a  bounce back up soon (but Bonds break the Rules, so don’t Buy). Longer tern Interest Rates could drop for a while and help the  Stock Market rally.  

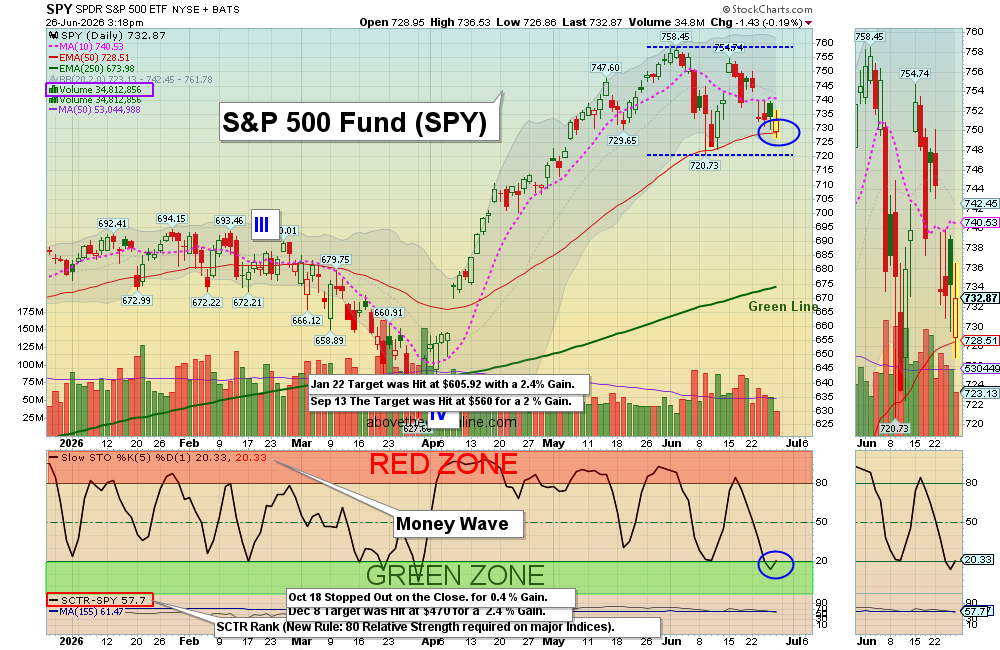
We are being conservative and only Buying Signals now if the Volume is High (at least 1.25 X the 50-day avg. Volume). The better trades happen when the S&P 500 Index is also in the Green Zone  (now coming down from the Red Zone). 

More Money Wave Buys soon in DAY TRADING SETUPS

Bonds  were down, and are below the Green Line.

Crude Oil was up $1.52 today at $61.27.

BUYS TODAY    3/3/2021   

TECK      TECK RESOURCES LTD.       Money Wave Buy today. Target is $23.50.  EXIT if it is going to Close below $20.61. 

JUMP START: (Buy Signal should be very soon… Click on the Jump Start link for more info.)   

FCEL      FUELCELL ENERGY INC.     Buy above $19.12 with High Volume with a 5% Trailing Sell Stop Loss below it. 

VERU      VERU INC.       Buy above $15.65 on High Volume with a 5 % Trailing Sell Stop Loss Below it. 

____________________________________________________________________________________________________________

WATCH LIST

WATCH LIST SCROLLING CHARTS (Real Time)      

GEVO      GEVO INC.

OCX      ONCOCYTE CORP.     

SINO      SINO GLOBAL SHIPPING

Please be patient and wait for Money Wave Buy Signals.  We will email you when they are ready. Follow on the WATCH LIST.
Emotions are very high now, so please do not Buy unless you are VERY NIMBLE.

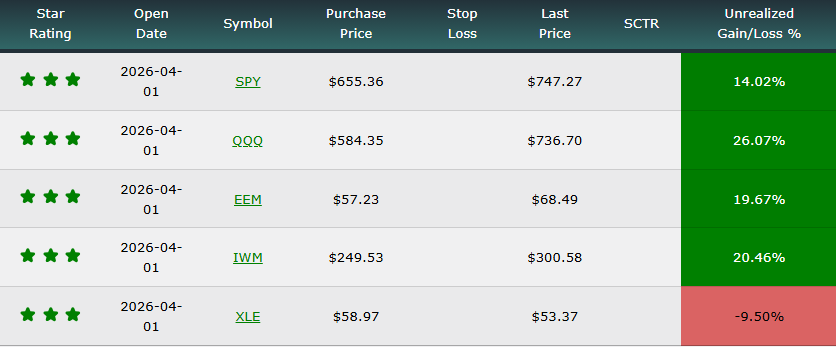
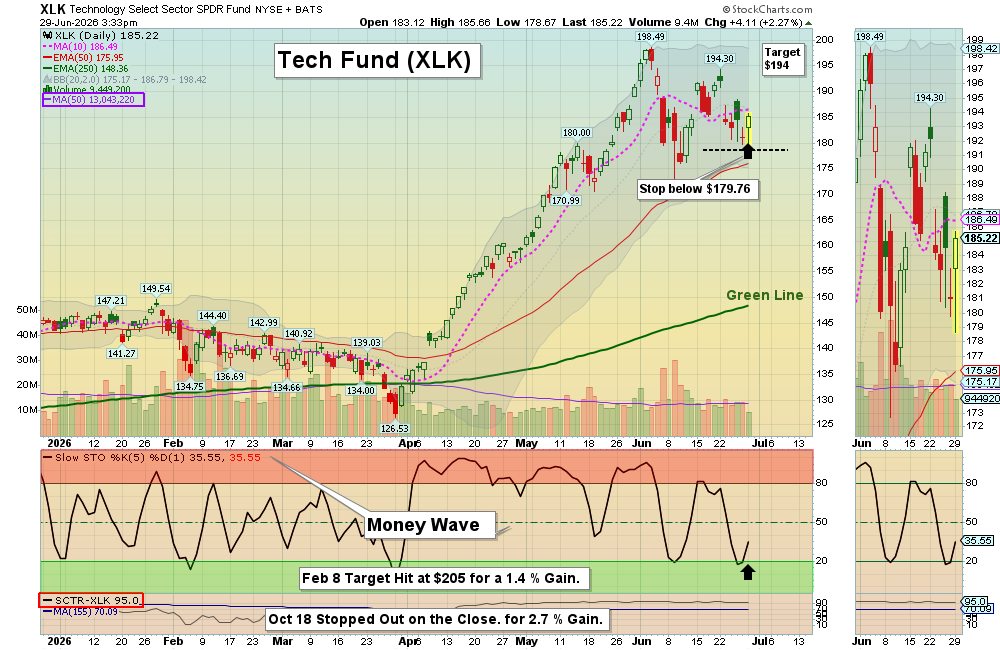
The Leaders are Way Above the Green Lines (all Investments eventually return to their Green Lines).

____________________________________________________________________________________________________________

SELLS TODAY  

BIDU      BAIDU INC.      LOWER the Sell Stop Loss below the Red Line of $257.60 until it bottoms. 

EXPR      EXPRESS INC.     Was Stopped Out last night when it Closed below $2.65.  This trade was not logged.   

DDD      3D SYSTEMS CORP.      LOWER the Sell Stop Loss below $26.50 until it bottoms. 

NIO      NIO INC.     LOWER the Sell Stop Loss below $40.00 until it bottoms. 

PLUG      PLUG POWER INC.      LOWER the Sell Stop Loss back down below $37.22.  

Z      ZILLOW GROUP      LOWER the Sell Stop Loss below $149.00.   

Please updates your Sell Stops.    

Click for  CURRENT POSITION CHARTS – Real Time  (Please check and adjust your Sell Stops).         
Click for  CLOSED POSITIONS,   
NEW:       MY TRADING DASHBOARD

DAY TRADING SETUPS
NEW:  TRADE ALERTS
ARE YOUR INVESTMENTS ABOVE THE GREEN LINE?
ETF SECTOR ROTATION SYSTEM   
TOP 100 LIST Updated Mar 1, 2021

Many like to Buy the day before, near the Close, if the Money Wave is going to create a Buy Signal (Closing > 20 and out of the Green Zone).

Don’t Buy if the Investment has already popped up too much. Money Wave Buys are usually good for a 3-6 %  move in a few days.

We will “Not Log” trades if the Reward/Risk is not at least 2:1.  These have more risk. 

Related Post

– TECK

– Money Wave Alert! Mar 2, 2021

Subscribe to Our Newsletter

AGL Logo

Get our eBook Now!

Candlestick - A Swing Traders Friend

We don’t spam! Read our privacy policy for more info.

You’ve been successfully subscribed to our newsletter!

Voted #1 at Stock Charts

SH Chart
Inverse S&P 500 Fund (SH) will have a Money Wave Buy today.

Help Us Help Animals

Help Us Help Animals

Recent Comments

  • Market Breadth Indicators: A Trader’s Guide to Early Trend Detection on Backtesting: Definition and How a Trading Strategy Backtest Works
  • Island Reversal Pattern: Definition and Formation Explained on Double Top Pattern: How to Identify and Trade This Reversal Signal
  • Channel Pattern Guide: What It Is and Why It Matters on A Guide to Forecasting Using Moving Averages
  • What Is a Broadening Bottom Chart Pattern? Full Guide on Bull vs. Bear Market: An Investor’s Guide to Market Phases
  • ATGL Weekly Money Flow - 2025-05-11 on ATGL Top Pick of the Week! Apr 6, 2025

Become a Green Liner!

Help me make more Money in the Stock Market.

ON ATGL

  • DashBoard
  • Weekly Commentary
  • Daily Buy / Sell Signals
  • Day Trade Setup
  • Trading Rooms

Design & Develop By Pixelvect

STRATEGIES

  • Swing Trading
  • ATGL Pick of the Week
  • Dividend Growth
  • ETF Sector Rotation
  • Dogs of the Dow

HELP

  • ATGL Trading Rules
  • FAQ
  • Account Maintenance
  • Contact US
  • Join

FOLLOW US

Instagram Linkedin Twitter Facebook

© COPYRIGHT 2024 · ABOVETHEGREENLINE.COM · ALL RIGHTS RESERVED · PRIVACY · TERMS · CONTACT · WATCHLIST · CURRENT