Above the Green Line -01
  • Market Insights
        • Commentary
          • Daily
          • Weekly
        • BUY / SELL SIGNALS
          • Trade Posts
          • Recent Trade Alerts
          • Recent Day Trades
        • BLOGROLL
          • Dividend Growth Blog
          • ETF Sector Blog
          • Dow Dogs
          • TPOW Blog
  • Strategies
        • SWING TRADING
          • Current Positions
          • Watchlists
          • Closed Positions
          • Candidates - TOP 100
          • Specialty Stocks
        • WEEKLY STOCK PICK
          • TPOW Charts
          • TPOW Performance
          • TPOW Strategy Guide
          • TPOW Performance Dashboard
        • DAY TRADING
          • Watch List
        • ATGL DASHBOARD
        • ETF STRATEGIES
          • ETF Sector Rotation
          • ETF Sector Portfolio
        • DIVIDEND GROWTH
          • Dividend Growth Portfolio
          • Dividend Calendar
        • DOGS OF THE DOW
          • Dogs of the Dow Portfolio
          • DOW 5 Portfolio
  • Markets
        • US MARKET
          • Commodities
          • Energy
          • Precious Metals
          • Volatility
        • GLOBAL MARKETS
          • Market Indices
          • Economic Calendar
          • FOREX Heat Map
          • FOREX Cross Rates
          • Crypto Currency Market
  • Investing
    • Discord Community
    • Dashboard
  • Resources
        • ARTICLES
          • Dividend Growth Model Articles
          • ETF Articles
          • Investment Strategies Articles
          • Market and Economic Insights
          • Stock Trade Articles
          • Stock Reviews
        • TOOLS
          • Stock Scanners
          • Charting Software
          • Brokerage Firms
        • STOCK CHARTS
          • Key Components
          • Reading Charts
          • Drawing Stock Charts
          • Identifying Trends
        • RETIREMENT PLANNING
  • About
    • Contact Us
    • How to Win
    • #1 At Stockcharts
    • Disclaimer
    • FAQ
  • Log In
  • Subscribe

March 2, 2021

Money Wave Alert! Mar 2, 2021

QQQ Chart
The NASDAQ 100 Fund (QQQ) is struggling at the Red Line.

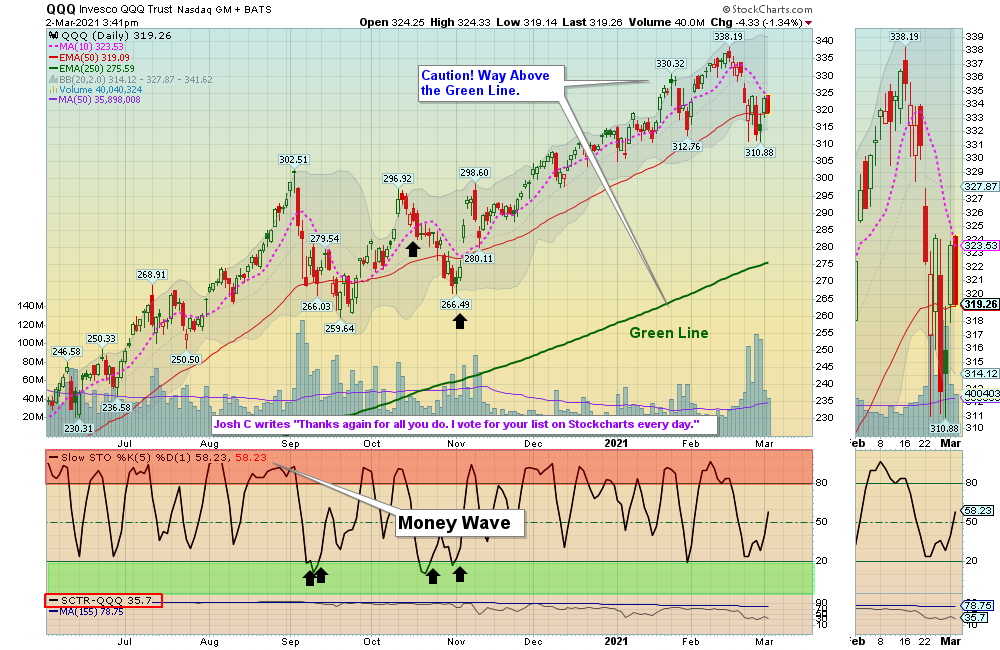
Markets were mixed today after yesterday’s big rally when the Indices bounced up off the Red Lines (50-day avgs.) Money Wave Pops have been weak, and the Markets need more Stimulus to boost confidence. The Senate should vote soon on the Plan.

Now the Indices need to make new Highs for the rally to continue. Bonds are very over-sold now and longer tern Interest Rates could drop for a while and help the  Stock Market rally.  The weak Volume is a warning. Please be PATIENT for the right Set Ups.

We are being conservative and only Buying Signals now if the Volume is High (at least 1.25 X the 50-day avg. Volume). The better trades happen when the S&P 500 Index is also in the Green Zone  (now coming down from the Red Zone). 

New Addition to the Dividend & Growth Strategy:  OKE    ONEOK INC.     with a current dividend yield of 8.44 % and an SCTR score of 83.40, will be added to the Dividend Growth Portfolio today using funds accumulated from monthly contributions the past three months.   OKE, along with its subsidiaries, engages in gathering, processing, storage, and transportation of natural gas in the United States. The company operates through Natural Gas Gathering and Processing, Natural Gas Liquids, and Natural Gas Pipelines segments. OKE was founded in 1906 and headquartered in Tulsa, Oklahoma.

Bonds  were down, and are below the Green Line.

Crude Oil was down $1.03 today at $59.61.

BUYS TODAY    3/2/2021   

BIDU      BAIDI INC.       Money Wave Buy today. BIDU will not be logged as the Volume is below average of 10.7 MIL.

ETM      ENTERCOM COMMUNICATIONS       Money Wave Buy today. ETM will not be logged as the Volume is below average of 2.1 MIL.

GRTS      GRITSTONE ONCOLOGY      Crossed above $14.82 but Volume was not High. GRTS will not be logged.  

We will “Not Log” trades if the Reward/Risk is not at least 2:1.  These have more risk. 

JUMP START: (Buy Signal should be very soon… Click on the Jump Start link for more info.)   

FCEL      FUELCELL ENERGY INC.     Buy above $19.12 with High Volume with a 5% Trailing Sell Stop Loss below it. 

VERU      VERU INC.       Buy above $15.65 on High Volume with a 5 % Trailing Sell Stop Loss Below it. 

____________________________________________________________________________________________________________

WATCH LIST

WATCH LIST SCROLLING CHARTS (Real Time)      

OCX      ONCOCYTE CORP.     

SINO      SINO GLOBAL SHIPPING

TECK      TECK RESOURCES LTD.

Please be patient and wait for Money Wave Buy Signals.  We will email you when they are ready. Follow on the WATCH LIST.
Emotions are very high now, so please do not Buy unless you are VERY NIMBLE.

The Leaders are Way Above the Green Lines (all Investments eventually return to their Green Lines).

____________________________________________________________________________________________________________

SELLS TODAY  

DDD      3D SYSTEMS CORP.      LOWER the Sell Stop Loss below $30.00 until it bottoms. Earning were lower than expected.

TAN      SOLAR FUND      EXIT if it is going to Close below your Buy Price, or  $103.34.     

Please updates your Sell Stops.    

Click for  CURRENT POSITION CHARTS – Real Time  (Please check and adjust your Sell Stops).         
Click for  CLOSED POSITIONS,   
NEW:       MY TRADING DASHBOARD

DAY TRADING SETUPS
NEW:  TRADE ALERTS
ARE YOUR INVESTMENTS ABOVE THE GREEN LINE?
ETF SECTOR ROTATION SYSTEM   
TOP 100 LIST Updated Mar 1, 2021

Many like to Buy the day before, near the Close, if the Money Wave is going to create a Buy Signal (Closing > 20 and out of the Green Zone).

Don’t Buy if the Investment has already popped up too much. Money Wave Buys are usually good for a 3-6 %  move in a few days.

We will “Not Log” trades if the Reward/Risk is not at least 2:1.  These have more risk. 

Related Post

– Money Wave Alert! Mar 1, 2021

Subscribe to Our Newsletter

AGL Logo

Get our eBook Now!

Candlestick - A Swing Traders Friend

We don’t spam! Read our privacy policy for more info.

You’ve been successfully subscribed to our newsletter!

Voted #1 at Stock Charts

SH Chart
Inverse S&P 500 Fund (SH) will have a Money Wave Buy today.

Help Us Help Animals

Help Us Help Animals

Recent Comments

  • Market Breadth Indicators: A Trader’s Guide to Early Trend Detection on Backtesting: Definition and How a Trading Strategy Backtest Works
  • Island Reversal Pattern: Definition and Formation Explained on Double Top Pattern: How to Identify and Trade This Reversal Signal
  • Channel Pattern Guide: What It Is and Why It Matters on A Guide to Forecasting Using Moving Averages
  • What Is a Broadening Bottom Chart Pattern? Full Guide on Bull vs. Bear Market: An Investor’s Guide to Market Phases
  • ATGL Weekly Money Flow - 2025-05-11 on ATGL Top Pick of the Week! Apr 6, 2025

Become a Green Liner!

Help me make more Money in the Stock Market.

ON ATGL

  • DashBoard
  • Weekly Commentary
  • Daily Buy / Sell Signals
  • Day Trade Setup
  • Trading Rooms

Design & Develop By Pixelvect

STRATEGIES

  • Swing Trading
  • ATGL Pick of the Week
  • Dividend Growth
  • ETF Sector Rotation
  • Dogs of the Dow

HELP

  • ATGL Trading Rules
  • FAQ
  • Account Maintenance
  • Contact US
  • Join

FOLLOW US

Instagram Linkedin Twitter Facebook

© COPYRIGHT 2024 · ABOVETHEGREENLINE.COM · ALL RIGHTS RESERVED · PRIVACY · TERMS · CONTACT · WATCHLIST · CURRENT