Above the Green Line -01
  • Market Insights
        • Commentary
          • Daily
          • Weekly
        • BUY / SELL SIGNALS
          • Trade Posts
          • Recent Trade Alerts
          • Recent Day Trades
        • BLOGROLL
          • Dividend Growth Blog
          • ETF Sector Blog
          • Dow Dogs
          • TPOW Blog
  • Strategies
        • SWING TRADING
          • Current Positions
          • Watchlists
          • Closed Positions
          • Candidates - TOP 100
          • Specialty Stocks
        • WEEKLY STOCK PICK
          • TPOW Charts
          • TPOW Performance
          • TPOW Strategy Guide
          • TPOW Performance Dashboard
        • DAY TRADING
          • Watch List
        • ATGL DASHBOARD
        • ETF STRATEGIES
          • ETF Sector Rotation
          • ETF Sector Portfolio
        • DIVIDEND GROWTH
          • Dividend Growth Portfolio
          • Dividend Calendar
        • DOGS OF THE DOW
          • Dogs of the Dow Portfolio
          • DOW 5 Portfolio
  • Markets
        • US MARKET
          • Commodities
          • Energy
          • Precious Metals
          • Volatility
        • GLOBAL MARKETS
          • Market Indices
          • Economic Calendar
          • FOREX Heat Map
          • FOREX Cross Rates
          • Crypto Currency Market
  • Investing
    • Discord Community
    • Dashboard
  • Resources
        • ARTICLES
          • Dividend Growth Model Articles
          • ETF Articles
          • Investment Strategies Articles
          • Market and Economic Insights
          • Stock Trade Articles
          • Stock Reviews
        • TOOLS
          • Stock Scanners
          • Charting Software
          • Brokerage Firms
        • STOCK CHARTS
          • Key Components
          • Reading Charts
          • Drawing Stock Charts
          • Identifying Trends
        • RETIREMENT PLANNING
  • About
    • Contact Us
    • How to Win
    • #1 At Stockcharts
    • Disclaimer
    • FAQ
  • Log In
  • Subscribe

April 23, 2017

Weekly Commentary Apr 23, 2017

DIA Chart

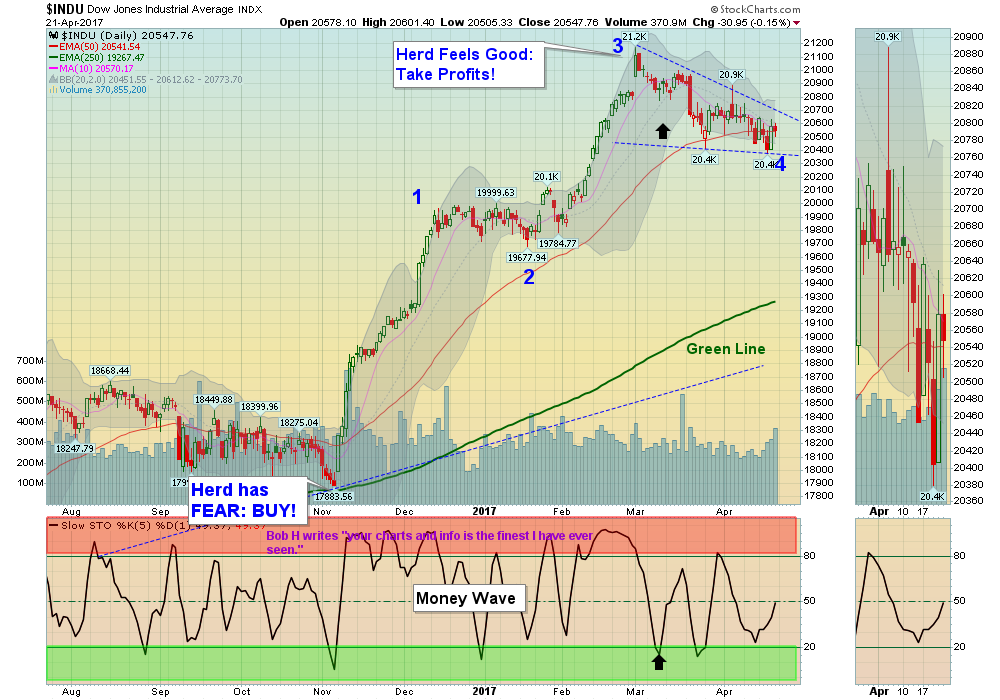
Can the Dow Go up Once more? 

04/23/2017:  Markets were up for the week, as the Strongest Leaders bounced Above the Red Lines (50-day avgs).  The weaker Indices (Dow, NYSE & Transports) had a few days below the Red Lines, indicating a lack of Buyers. It looks like only Congress can save the day, by agreeing  on some kind of Tax Reform or a new HealthCare bill.

Even the recent Money Wave Pops on the strongest Darlings (mainly large cap NASDAQ 100 stocks like AAPL FB AMZN GOOGL, etc.) have been disappointing. Please be patient, as the trading should get better once some better selling comes in… Currently the S&P has Support at 2322, for a possible “W” pattern back up to the March Highs again.

Bonds have rallied all the way back up to the Green Line, indicating either War Fears, or expectations of a Slowing Economy…

Crude OIL was down over 6% for the week, after FAILING below $55.24 Resistance again.

The Financials have really weakened, on possible slow down fears.


MONEY WAVE BUYS SOON:    There are currently 11 Open Positions,  and 4 Investments are on the Watch List. 

ON DECK to Buy soon:  Watch List.  Wait for GREEN ZONE BUYS.  We will email or text when they are ready.  


LONG TERM TRADES – We are looking for a good Entry Point for these, which could possibly Double:

DBC   COMMODITY FUND   Waiting for Break Out Above $16.08.
IPI    INTREPID POTASH    Waiting for Break Out Above $3.04.
JJC     COPPER FUND            Waiting on a Pull-back.
KOL    COAL FUND         Waiting for a Pull-back.
MDR    MCDERMOTT INT’L.  Waiting for Bounce Up & Above 90 Relative Strength.
UGA   US GASOLINE FUND   Waiting on Break Out Above $32.03.
WFM   WHOLE FOODS MARKET   Waiting on a Pull-back.


Click for  Portfolio (Open Positions)  
Click for  Watch List
Click for  Closed Positions


Alert! Market Risk is Lower now (Yellow Zone). The probability of successful Short Term Trades is lower, when the S&P 500 is Way Above the Green Line. Even the Strongest Funds can get chopped up. Either take quick gains from Money Wave Pops, or STAY IN CASH & WAIT for a larger correction.

[s_static_display]

Tell your Friend about us, and HELP ANIMALS.

Related Post

– Weekly Commentary Apr 15, 2017

Subscribe to Our Newsletter

AGL Logo

Get our eBook Now!

Candlestick - A Swing Traders Friend

We don’t spam! Read our privacy policy for more info.

You’ve been successfully subscribed to our newsletter!

Voted #1 at Stock Charts

SH Chart
Inverse S&P 500 Fund (SH) will have a Money Wave Buy today.

Help Us Help Animals

Help Us Help Animals

Recent Comments

  • Market Breadth Indicators: A Trader’s Guide to Early Trend Detection on Backtesting: Definition and How a Trading Strategy Backtest Works
  • Island Reversal Pattern: Definition and Formation Explained on Double Top Pattern: How to Identify and Trade This Reversal Signal
  • Channel Pattern Guide: What It Is and Why It Matters on A Guide to Forecasting Using Moving Averages
  • What Is a Broadening Bottom Chart Pattern? Full Guide on Bull vs. Bear Market: An Investor’s Guide to Market Phases
  • ATGL Weekly Money Flow - 2025-05-11 on ATGL Top Pick of the Week! Apr 6, 2025

Become a Green Liner!

Help me make more Money in the Stock Market.

ON ATGL

  • DashBoard
  • Weekly Commentary
  • Daily Buy / Sell Signals
  • Day Trade Setup
  • Trading Rooms

Design & Develop By Pixelvect

STRATEGIES

  • Swing Trading
  • ATGL Pick of the Week
  • Dividend Growth
  • ETF Sector Rotation
  • Dogs of the Dow

HELP

  • ATGL Trading Rules
  • FAQ
  • Account Maintenance
  • Contact US
  • Join

FOLLOW US

Instagram Linkedin Twitter Facebook

© COPYRIGHT 2024 · ABOVETHEGREENLINE.COM · ALL RIGHTS RESERVED · PRIVACY · TERMS · CONTACT · WATCHLIST · CURRENT