
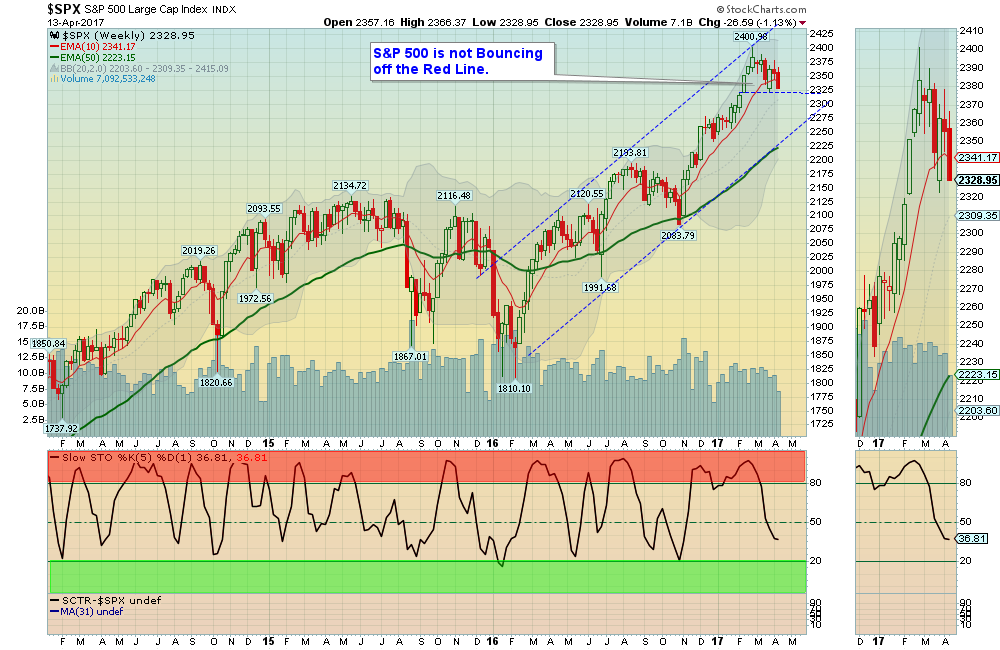
04/015/2017: Markets were down about 1% for the week, as Investors are becoming worried if Congress will agree on Tax Reform and a new HealthCare bill. The major Indices did not bounce off of the Red Lines (see Chart above), which indicates a lack of Buying, except for only the strongest Darlings (mainly large cap NASDAQ 100 stocks like AAPL FB AMZN GOOGL, etc.) There is Support on the S&P at 2322, for a possible “W” pattern back up to the Highs again soon.
Bonds have rallied all the way back up to the Green Line, indicating either War Fears, or expectations of a Slowing Economy…
Crude OIL was up 1.8% for the week, but it needs to Close above $55.24 for a Bull to begin.
The Financials have really weakened, as longer term Interest Rates dropped on Bond buying.
Gold Miners were up 4% as the US Dollar fell.
MONEY WAVE BUYS SOON: There are currently 7 Open Positions, and 11 Investments are on the Watch List. Many Investments were Stopped Out on Thursday.
ON DECK to Buy soon: Watch List. Wait for GREEN ZONE BUYS. We will email or text when they are ready.
LONG TERM TRADES – We are looking for a good Entry Point for these, which could possibly Double:
DBC COMMODITY FUND Waiting for Break Out Above $16.08.
IPI INTREPID POTASH Waiting for Break Out Above $3.04.
JJC COPPER FUND Waiting on a Pull-back.
KOL COAL FUND Waiting for a Pull-back.
MDR MCDERMOTT INT’L. Waiting for Bounce Up & Above 90 Relative Strength.
UGA US GASOLINE FUND Waiting on Break Out Above $32.03.
Click for Portfolio (Open Positions)
Click for Watch List
Click for Closed Positions
Alert! Market Risk is Lower now (Yellow Zone). The probability of successful Short Term Trades is lower, when the S&P 500 is Way Above the Green Line. Even the Strongest Funds can get chopped up. Either take quick gains from Money Wave Pops, or STAY IN CASH & WAIT for a larger correction.
[s_static_display]
Tell your Friend about us, and HELP ANIMALS.
QUESTION: Doug writes: “I am considering your service and am curious as to the difference in RSf numbers and RS ranking from investors.com. Is it a weighting difference in the near term quarter or something else altogether?”
ANSWER: Hi Doug, we prefer to use Relative Strength from IBD (Investor’s Business Daily) or www.etfscreen.com, as they use more of a weighted 1 year RS.
SCTR (Stock Charts Technical Rank) is more convenient, but is weighted too much to the last 90 days of trading…
Good trading, and tell your friends!


