
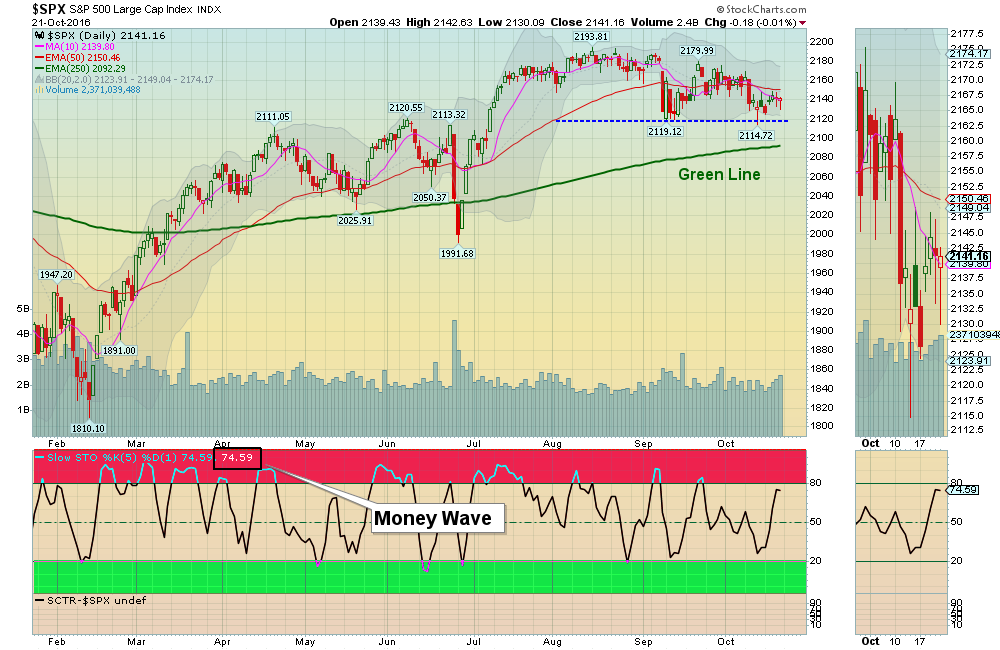
S&P 500 is going sideways, indicating a BIG MOVE SOON!
10/22/2016: Markets were up slightly for the week as the S&P 500 struggled below the Red Line (50-day average). Markets are no longer benefitting from Low Interest Rates and Oil Prices. So far the Markets are holding up well for October, and it looks like most are waiting for the November Election results. The S&P 500 Closing below 2119 could be Bearish!
The Strongest Leaders have bounced off their Red Lines (50-day avgs.) and need to MAKE HIGHER HIGHS for this rally to continue. Our Money Wave Buy Pops have been poor lately, indicating Money is not Entering the Markets (Few new Highs).
Average Investments that are currently Below the Green Line, and have not made Highs recently, Should BE SOLD soon (or you can get stuck in them).
Wait for Money Waves Buys coming out of the Green Zones. We will email you when they are ready. Watch List
Current Open Positions Closed Positions Charts for Leaders
Alert! Market Risk Medium (Yellow Zone). The probability of successful Short Term Trades is lower, when the S&P 500 is Way Above the Green Line. Even the Strongest Funds can get chopped up. Either take quick gains from Money Wave Pops, or STAY IN CASH & WAIT for a larger correction.
QUESTION: When it says “Caution! Way Above the Green Line.”
Joe asks “What criteria do you employ to determine other than being in the red zone to make the statement? Charts are great.”
ANSWER: Way Above the Green Line means that you will probably have a “sick feeling” when the Investment RETURNS to the Green Line. YELP was Way Above the Green Line at $43… Now it on Sale at $34 (21% off), and we should get a Buy Signal soon.
Tell your Friends about us, and HELP ANIMALS.