Above the Green Line -01
  • Market Insights
        • Commentary
          • Daily
          • Weekly
        • BUY / SELL SIGNALS
          • Trade Posts
          • Recent Trade Alerts
          • Recent Day Trades
        • BLOGROLL
          • Dividend Growth Blog
          • ETF Sector Blog
          • Dow Dogs
          • TPOW Blog
  • Strategies
        • SWING TRADING
          • Current Positions
          • Watchlists
          • Closed Positions
          • Candidates - TOP 100
          • Specialty Stocks
        • WEEKLY STOCK PICK
          • TPOW Charts
          • TPOW Performance
          • TPOW Strategy Guide
          • TPOW Performance Dashboard
        • DAY TRADING
          • Watch List
        • ATGL DASHBOARD
        • ETF STRATEGIES
          • ETF Sector Rotation
          • ETF Sector Portfolio
        • DIVIDEND GROWTH
          • Dividend Growth Portfolio
          • Dividend Calendar
        • DOGS OF THE DOW
          • Dogs of the Dow Portfolio
          • DOW 5 Portfolio
  • Markets
        • US MARKET
          • Commodities
          • Energy
          • Precious Metals
          • Volatility
        • GLOBAL MARKETS
          • Market Indices
          • Economic Calendar
          • FOREX Heat Map
          • FOREX Cross Rates
          • Crypto Currency Market
  • Investing
    • Discord Community
    • Dashboard
  • Resources
        • ARTICLES
          • Dividend Growth Model Articles
          • ETF Articles
          • Investment Strategies Articles
          • Market and Economic Insights
          • Stock Trade Articles
          • Stock Reviews
        • TOOLS
          • Stock Scanners
          • Charting Software
          • Brokerage Firms
        • STOCK CHARTS
          • Key Components
          • Reading Charts
          • Drawing Stock Charts
          • Identifying Trends
        • RETIREMENT PLANNING
  • About
    • Contact Us
    • How to Win
    • #1 At Stockcharts
    • Disclaimer
    • FAQ
  • Log In
  • Subscribe

July 12, 2020

Green Line Weekly! Jul 12, 2020

M1 Chart
Massive FED Printing is holding the Markets up.

07/12/2020 Markets were up again for the week as the Indices are trying to get back up to the early June Highs. The S&P 500 Index is doing a “W” pattern off the Red Line (50-day avg.) and needs to exceed the June Highs for this rally up to continue. Most of the recent Market rally has been limited to a small percentage of Large Cap Stocks. The CNN Fear & Greed Index is back up to 59.

After the recent upward “Buying Climax” on the very Strongest Leaders is complete, they will finally pull-back. Most Investors don’t have the patience or discipline to WAIT for AAPL ADBE AMZN DOCU NFLX NVDA PYPL QQQ SHOP TSLA TWLO & ZS to correct. They might stretch a little higher, but eventually the Leaders will pull back near the Red Lines (50-day averages) like they always do.

We will WAIT on the Leaders to pull-back instead of buying weaker Investments, even if they still meet the Green Line Rules.

Please WAIT for Watch List  to grow with Leaders when they return to the Green Zones for Money Wave Buy Signals.

For the week the Dow was up 0.93%, the S&P 500 was up 1.72%, and the Nasdaq 100 was up 4.67%. The Long Term Trend for the Indices is up. 

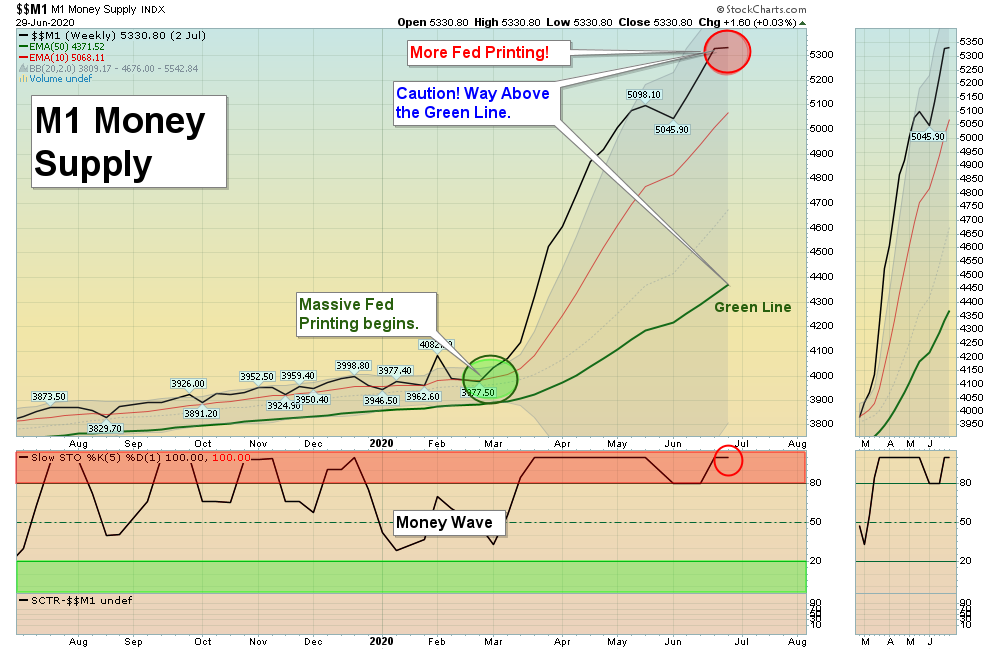
The Inflation Index (CRB) was up 0.66% and is Below the Green Line, indicating Economic Weakness.

Bonds  were up 1.67% for the week and are Above the Green Line, indicating Economic Weakness.

The US DOLLAR was down 0.65 % for the week and is Below the Green Line. 

Crude Oil was down 0.25% for the week at $40.55 and GOLD was up 0.66%  at $1801.90, a New High.


COMPLETED TRADES THIS WEEK

SEDG     SOLAREDGE TECH     Target Hit at $155 for a 12.3 % Gain.     
VXX     VOLATILITY INDEX     Stopped Out for a 1 % Loss.
Z      ZILLOW GROUP      Target Hit at $65 for a 12.9 % Gain. 

_____________________________________________________________________________________________

MONEY WAVE BUYS SOON

We are currently in 0 logged Current Positions, for the Short & Medium Term.  There are 6 Investments on the Short Term Watch List. 

Be patient and WAIT for Green Zone Buy Signals!

______________________________________________________________________________________________

LONG TERM INVESTMENTS  (Most of the Leaders are back up in the Weekly Red Zones.)

Buy the Leading Investments that are down near the Weekly Green Zones.     

AUY      YAMANA GOLD      Buy if it Closes above $5.73 on High Volume.  All time High is $18.50.     
IOVA     IOVANCE BIO.      Wait for the next Daily Money Wave Buy.  

NG        NOVA GOLD RESOURCES       Buy if it Closes above $9.28 on High Volume.  All time High s $16.00.     

RRC     RANGE RESOURCES CORP.       Buy if it Closes above $7.14 on High Volume. All time High is $92.45.  

______________________________________________________________________________________

Click for  Current Positions
Click for  Watch List
Click for  Closed Positions

NEW DAY TRADE LIST JUN 27, 2020

TOP 100 LIST JUL 2, 2020

Dividend Growth Portfolio  (we are now posting a Dividend Calendar for the entire portfolio to assist with planning purposes).

ETF Sector Rotation System –  New Quarterly Rotation was on June 30 & July 1, 2020.

Dogs of the DOW System

Long Term Strategy for IRAs & 401k Plans

CNN Fear & Greed Index

Alert! Market Risk is MEDIUM (Yellow Zone). The probability of successful Short Term Trades is better, when the % of stocks above the 50-day avg. is below 20. 

Tell your Friends about the Green Line, and Help Animals

___________________________________________________________________________________________

QUESTION: Arvind writes “I joined the Green Line 2 days ago. How do I get a chart of my own ticker symbol?”

ANSWER:  Hi Arvind, if you go down to the link on the Daily emails:

ARE YOUR INVESTMENTS ABOVE THE GREEN LINE? 

You can pull up your own Charts. To make the CHARTS LARGER , input the Symbol, and scroll down to change the Size to Landscape, and then Click on the Update button.

Thank you,

AGL

Related Post

– Green Line Weekly! Jul 5, 2020

Subscribe to Our Newsletter

AGL Logo

Get our eBook Now!

Candlestick - A Swing Traders Friend

We don’t spam! Read our privacy policy for more info.

You’ve been successfully subscribed to our newsletter!

Voted #1 at Stock Charts

SH Chart
Inverse S&P 500 Fund (SH) will have a Money Wave Buy today.

Help Us Help Animals

Help Us Help Animals

Recent Comments

  • Market Breadth Indicators: A Trader’s Guide to Early Trend Detection on Backtesting: Definition and How a Trading Strategy Backtest Works
  • Island Reversal Pattern: Definition and Formation Explained on Double Top Pattern: How to Identify and Trade This Reversal Signal
  • Channel Pattern Guide: What It Is and Why It Matters on A Guide to Forecasting Using Moving Averages
  • What Is a Broadening Bottom Chart Pattern? Full Guide on Bull vs. Bear Market: An Investor’s Guide to Market Phases
  • ATGL Weekly Money Flow - 2025-05-11 on ATGL Top Pick of the Week! Apr 6, 2025

Become a Green Liner!

Help me make more Money in the Stock Market.

ON ATGL

  • DashBoard
  • Weekly Commentary
  • Daily Buy / Sell Signals
  • Day Trade Setup
  • Trading Rooms

Design & Develop By Pixelvect

STRATEGIES

  • Swing Trading
  • ATGL Pick of the Week
  • Dividend Growth
  • ETF Sector Rotation
  • Dogs of the Dow

HELP

  • ATGL Trading Rules
  • FAQ
  • Account Maintenance
  • Contact US
  • Join

FOLLOW US

Instagram Linkedin Twitter Facebook

© COPYRIGHT 2024 · ABOVETHEGREENLINE.COM · ALL RIGHTS RESERVED · PRIVACY · TERMS · CONTACT · WATCHLIST · CURRENT