
By ATGL
Updated March 14, 2026
Day trading involves buying and selling securities within a single trading day and can be a highly profitable trade strategy if executed with precision and foresight. Recognizing reliable day trading patterns is critical, as they are backed by historical data and technical analysis and offer a framework for identifying potential entry and exit points.
By understanding these configurations, day traders can optimize their trade timings and increase their chances of executing successful trades. This article discusses six patterns that everyday trader should be familiar with to enhance their trading efficacy.
Day trading patterns are tactical tools used within broader market approaches such as day trading, swing trading, and momentum trading. Investors who want to understand how these approaches fit within a larger framework of portfolio and trading decisions can review the Investment Strategies Guide, which explains the key principles behind different investment strategies.
Do Day Trading Patterns Really Work?
Day trading patterns are foundational tools traders use to navigate the fast-paced and often volatile day trading environment. These patterns are theoretical constructs grounded in the psychological and behavioral tendencies of market participants. Recognizing patterns like the Bull Flag and Double Bottom represent recurring trends and shifts in market sentiment that can provide a competitive edge to a trader.
However, pattern effectiveness can vary based on market conditions, trading volume, and external influences such as economic announcements or shifts in monetary policy. While these patterns are instrumental, traders should apply them within a comprehensive trading strategy that includes risk management and continuous market analysis. By integrating these patterns with other analytical tools, traders can enhance their decision-making process and improve the probability of achieving favorable outcomes.
Top 6 Day Trading Patterns You Should Know
Understanding key day trading patterns can significantly impact trading decisions and outcomes. Here are six patterns that are particularly critical for their predictive value and recurrence in the markets.
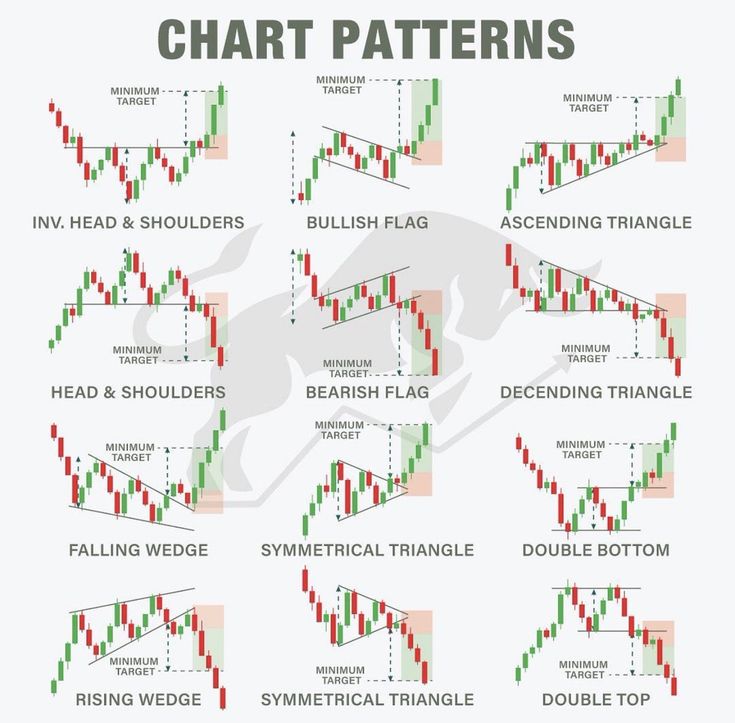
1. Bull Flag Pattern: Look for a Flag-Shaped Consolidation
Characterized by a strong initial upward trend followed by a downward-sloping consolidation, the Bullish Flag pattern is a continuation pattern signaling potential upward movements. The consolidation phase often features reduced volumes, suggesting a temporary halt in buying activity.
Traders should watch for a breakout above the consolidation’s upper boundary. Such a breakout typically indicates a continuation of the prior uptrend and provides an optimal entry point for long positions.
2. Double Bottom Pattern: Identify Two Troughs
The Double Bottom pattern is a bullish reversal indicator that appears after a significant downtrend, showing two distinct troughs at approximately the same price level. This pattern signifies a strong support level where the closing price fails to drop further, signaling a potential reversal of the prevailing downtrend.
Volume plays a crucial role here, as an increase in volume on the second trough suggests more substantial buying interest and a likely shift in momentum. Traders who identify this pattern can set strategic entry points above the neckline — the peak between the two troughs — with targets set based on the height of the formation.
3. Ascending Triangle Pattern: Look for Higher Lows and a Flat
Typically emerging during an uptrend, the Ascending Triangle pattern forms through higher lows and a flat resistance line, signaling a bullish pattern continuation. This right-angle triangle suggests that buyers gradually overcome sellers by consistently pushing the price up against a steady resistance level.
Confirmation of this pattern comes with a breakout above the resistance, usually accompanied by a spike in trading volume, signaling the continuation of the initial uptrend. Following such a breakout, positioning for upward movement can be highly advantageous.
4. Head and Shoulders Pattern: Identify Three Peaks
The Head and Shoulders pattern, with its three peaks including the highest central “head,” denotes a potential reversal from an existing uptrend to a downtrend. Forming when prices first rise to a peak and decline, followed by a higher peak, another decline, and finally a lower peak, this pattern outlines the completion when prices drop below the support level known as the neckline.
Monitoring for a price breakout below this level is critical as it often marks a sell signal, suggesting a potential for significant downward price movement.
5. Rising Wedge Pattern: Observe Wedge Higher Highs and Lows
The Rising Wedge pattern is typically a bearish reversal pattern that occurs in both uptrends and downtrends. It is characterized by higher highs and higher lows that converge toward a single point, creating a narrowing shape. This pattern suggests that despite the rising price, the upward momentum is weakening as the advances become increasingly smaller, which can demonstrate diminishing buyer enthusiasm and potential exhaustion.
The pattern is confirmed when the price breaks below the lower support trend line. This breakout is often accompanied by increased volume, signaling a reliable entry point for traders expecting the price to decline further.
6. Bearish Engulfing Pattern: Look for a Large Bearish Candle
The Bearish Engulfing pattern is a significant technical indicator of a possible reversal from an uptrend to a downtrend. It occurs when a large bearish candlestick fully engulfs the body of the previous day’s smaller bullish candlestick. This pattern typically forms at the peak of an uptrend, suggesting that sellers have overtaken buyers and a shift in momentum is imminent. The larger the bearish candle, the more significant the potential reversal.
Traders should look for increased volume during the formation of the bearish engulfing candle as it enhances the reliability of the pattern as a strong selling signal, potentially leading to a substantial drop in prices.
Become a Successful Day Trader With Above the Green Line
Day trading can be an exhilarating yet complex endeavor that requires an understanding of important trading patterns and a system for timely and accurate decision-making. Whether you are new to day trading or looking to sharpen your trading skills, Above the Green Line provides you with the powerful tools and strategies to confidently identify and execute potential trades.
Our platform emphasizes using proprietary metrics and real-time data to empower traders, enhancing your ability to act swiftly on market opportunities. Leverage the insights and analytical tools Above the Green Line offers to refine your trading techniques and increase your financial market acumen.
Ready to elevate your trading game? Visit our comprehensive guide on day trading to learn about current trends and start trading smarter today.

Related Articles

Are Municipal Bonds Tax Free? What Investors Need to Know

Reinvestment Strategy: Turning Income into Compounding Wealth

How the Elder Impulse System Helps Traders Time Their Entries

Kelly Criterion Trading: How to Size Positions with Confidence

[…] structured process complements other essential day trading patterns and serves as a robust foundation for trade selection and […]