Above the Green Line -01
  • Market Insights
        • Commentary
          • Daily
          • Weekly
        • BUY / SELL SIGNALS
          • Trade Posts
          • Recent Trade Alerts
          • Recent Day Trades
        • BLOGROLL
          • Dividend Growth Blog
          • ETF Sector Blog
          • Dow Dogs
          • TPOW Blog
  • Strategies
        • SWING TRADING
          • Current Positions
          • Watchlists
          • Closed Positions
          • Candidates - TOP 100
          • Specialty Stocks
        • WEEKLY STOCK PICK
          • TPOW Charts
          • TPOW Performance
          • TPOW Strategy Guide
          • TPOW Performance Dashboard
          • Why Weekly Trading Works
        • DAY TRADING
          • Watch List
        • ATGL DASHBOARD
        • ETF STRATEGIES
          • ETF Sector Rotation
          • ETF Sector Portfolio
        • DIVIDEND GROWTH
          • Dividend Growth Portfolio
          • Dividend Calendar
        • DOGS OF THE DOW
          • Dogs of the Dow Portfolio
          • DOW 5 Portfolio
  • Markets
        • US MARKET
          • Commodities
          • Energy
          • Precious Metals
          • Volatility
        • GLOBAL MARKETS
          • Market Indices
          • Economic Calendar
          • FOREX Heat Map
          • FOREX Cross Rates
          • Crypto Currency Market
  • Investing
    • Discord Community
    • Dashboard
  • Resources
        • ARTICLES
          • Dividend Growth Model Articles
          • ETF Articles
          • Investment Strategies Articles
          • Market and Economic Insights
          • Stock Trade Articles
          • Stock Reviews
        • TOOLS
          • Stock Scanners
          • Charting Software
          • Brokerage Firms
          • Stocks We Review
        • STOCK CHARTS
          • Key Components
          • Reading Charts
          • Drawing Stock Charts
          • Identifying Trends
        • RETIREMENT PLANNING
  • About
    • Contact Us
    • How to Win
    • #1 At Stockcharts
    • Disclaimer
    • FAQ
  • Log In
  • Subscribe

Archives for 2018

April 24, 2018

Money Wave Alert! Apr 24, 2018

SPX 60

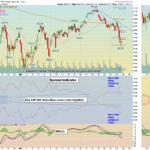
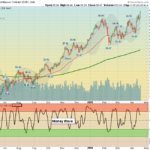
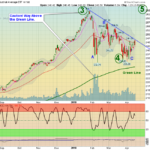
  Markets were down again today as some Earnings were disappointing, and Interest Rates rose. If the S&P 500 can hold here at the 62% Retracement level down of the April bounce, then a good rally up could happen soon. Some of the … [Read more...]

April 23, 2018

Money Wave Alert! Apr 23, 2018

INTC Chart

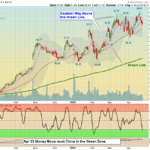
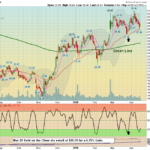
  Markets were down again today as the Indices slipped below the the Red Lines (50-day avgs.) which created some Short Term Sell Signals. Some of the Leaders are quickly cycling back down near the Green Zones... Please be patient and WAIT … [Read more...]

April 22, 2018

Green Line Weekly Apr 22, 2018

CRB Chart

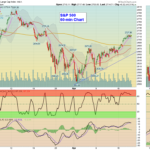
  04/22/2018:  Markets were up slightly for the week, but profit taking came as the Indices were up in the Red Zones (probably too late to Buy for the Short Term). The Markets are back to trading between the Red Lines and Green Lines, until a … [Read more...]

April 20, 2018

Money Wave Alert! Apr 20, 2018

SPX Chart

  Markets were down more today as the Indices have slipped below the the Red Lines (50-day avgs.) which creates some Short Term Sell Signals. Many of the Leaders were back up in the Red Zones (probably too late to Buy for the Short … [Read more...]

April 19, 2018

Money Wave Alert! Apr 19, 2018

WTIC Chart

  Markets were down today on mild selling as stocks were over-bought for the Short Term.  Markets could stall or pull back some for a while. Most of the Indices are now Above the Red Lines (50-day avgs.) which normally means a re-test of the … [Read more...]

April 18, 2018

Money Wave Alert! Apr 18, 2018

SPX 60

  Markets were mixed today as the rally off the Green Line is over-bought for the Short Term.  Markets could stall or pull back some for a while. Most of the Indices are now Above the Red Lines (50-day avgs.) which normally means a re-test of … [Read more...]

April 17, 2018

Money Wave Alert! Apr 17, 2018

QQQ Chart

  Markets "Gapped Up today on the excitement of NetFlix Earnings. Most of the Indices are now Above the Red Lines (50-day avgs.)  The Markets getting back above the Red Lines normally means a rally back up to the Jan Highs. Buy many of the … [Read more...]

April 16, 2018

Money Wave Alert! Apr 16, 2018

M Chart

  Markets were up as the Indices went back up to the Red Lines (50-day avgs.) Many of the Leaders are now back up in the Red Zones (probably too late to Buy for the Short Term)... Markets could stall or pull back some for a while. A rally … [Read more...]

April 15, 2018

Green Line Weekly Apr 15, 2018

DIA Chart

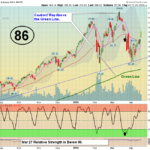
  04/15/2018:  Markets were up 1 1/2 to 3% for the week, as the Indices rallied up again to the Red Lines (50-day avgs.)    This is very normal for the Markets to trade between the Red Lines and Green Lines, until one of the Lines is … [Read more...]

April 13, 2018

Money Wave Alert! Apr 13, 2018

SPX 60 Chart

  Markets were lower today after tagging the Red Lines (50-day avgs.) and selling off. Many of the Leaders are quickly getting back up in the Red Zones (probably too late to Buy for the Short Term)... Markets could stall or pull back some for … [Read more...]

  • « Previous Page
  • 1
  • …
  • 20
  • 21
  • 22
  • 23
  • 24
  • …
  • 31
  • Next Page »

Subscribe to Our Newsletter

AGL Logo

Get our eBook Now!

Candlestick - A Swing Traders Friend

We don’t spam! Read our privacy policy for more info.

You’ve been successfully subscribed to our newsletter!

Voted #1 at Stock Charts

SH Chart
Inverse S&P 500 Fund (SH) will have a Money Wave Buy today.

Help Us Help Animals

Help Us Help Animals

Recent Comments

  • ATGL Weekly Money Flow - 2026-02-08 on ATGL Top Pick of the Week! Jan 25, 2026
  • ATGL Weekly Money Flow - 2026-01-25 on ATGL Top Pick of the Week! Jan 11, 2026
  • ATGL Weekly Money Flow - 2025-12-28 on ATGL Top Pick of the Week Dec 21, 2025
  • Inside Bar Trading Strategy: Improve Timing and Wins on Price Action Trading: Mastering the Art of Reading the Market Without Indicators
  • Breakaway Gap Explained: Identify High-Probability Setups on Identifying Market Exhaustion Signals for Smarter Trading Decisions

Become a Green Liner!

Help me make more Money in the Stock Market.

ON ATGL

  • DashBoard
  • Weekly Commentary
  • Daily Buy / Sell Signals
  • Day Trade Setup
  • Trading Rooms

Design & Develop By Pixelvect

STRATEGIES

  • Swing Trading
  • ATGL Pick of the Week
  • Dividend Growth
  • ETF Sector Rotation
  • Dogs of the Dow

HELP

  • ATGL Trading Rules
  • FAQ
  • Account Maintenance
  • Contact US
  • Join

FOLLOW US

Instagram Linkedin Twitter Facebook

© COPYRIGHT 2024 · ABOVETHEGREENLINE.COM · ALL RIGHTS RESERVED · PRIVACY · TERMS · CONTACT · WATCHLIST · CURRENT