
04/22/2018: Markets were up slightly for the week, but profit taking came as the Indices were up in the Red Zones (probably too late to Buy for the Short Term). The Markets are back to trading between the Red Lines and Green Lines, until a DECISION is made (Up or Down).
Earnings are starting to come out, so maybe the Indices make a Higher Low soon and re-test the Jan Highs. A Higher Low would convince most that the Selling is over.
Some of the Strongest Investments that held Above their Red Lines are back up near the Highs. The Long Term Trend is UP.
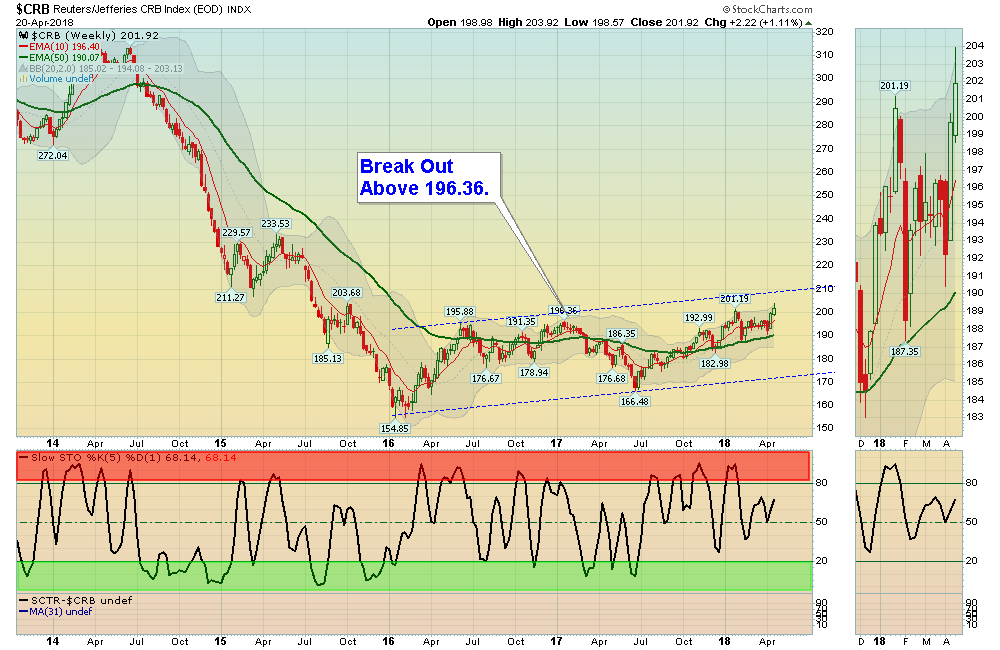
The Inflation Index (CRB) was able to make New Highs this week at 203.92, and is now in a mild Up-Trend.
Bonds are bearish (Below the Green Line and Low Relative Strength) and Failed at the Green Line (250-day avg.) Support is at the February Lows.
The US DOLLAR made a Higher Low, and is now Above the Red Line (50-day avg.) but the trend is still down.
Crude Oil was up 1.50% for the week and made a New High at $69.55, and GOLD was down 0.71%.
___________________________________________________________________________________________
MONEY WAVE BUYS SOON: We are currently in 9 logged Open Positions, for the Short & Medium Term. There are 2 Investments on the Short Term Watch List. Be patient and WAIT for Green Zone Buys!
______________________________________________________________________________________________
LONG TERM TRADES
The Funds below are currently out of favor and and recent news has cause more weakness. Some are having trouble with nice uptrends. But historically these could possibly Double or more from these lower levels. We are looking for a good Entry Point for these, but need the entire Economy & Inflation to pick up speed:
We missed SGMS SCIENTIFIC GAMES this week when it broke the Down-Trend line.
DBC COMMODITY FUND Buy next time down in Daily Green Zone.
KOL COAL FUND Relative Strength is back Below 90.
REMX RARE EARTH FUND Volume is too Low.
USO US OIL FUND Buy next time down in Daily Green Zone.
___________________________________________________________________________________________
Click for Portfolio (Open Positions)
Click for Watch List
Click for Closed Positions
Alert! Market Risk is Medium (Yellow Zone). The probability of successful Short Term Trades is higher, when the S&P 500 is down near the Green Line.
Tell your Friends about the Green Line, and Help Animals.
QUESTION: Greg writes “I have been watching off and on for years your blog on stockcharts.com and I finally decided to join your AbovetheGreenLine service yesterday! I would like an estimate of the normal/usual number of open positions so I know how to allocate my resources.
Thanks.”
ANSWER: Hi Greg, and thank you for subscribing! Normally the number of Open Positions is 4-7. Currently it is higher, as the Markets were very Over-Sold last month.
Good trading, and tell your friends!


