Above The Green Line

  • Commentary
    • BUY / SELL SIGNALS
      • Trade Alerts
    • DIVGRO BLOG
    • ETF SECTOR BLOG
    • DOW DOGS BLOG
    • NEWS
    • STOCK IDEAS
  • Strategies
    • SWING TRADING
      • CURRENT POSITIONS
      • WATCHLISTS
      • CLOSED POSITIONS
      • CANDIDATES – TOP 100
      • SPECIALTY STOCKS
    • DAY TRADING
      • Watch List
    • DIVIDEND GROWTH
      • Dividend Growth Portfolio
      • Dividend Calendar
    • DOGS OF THE DOW
      • Dogs of the Dow Portfolio
      • DOW 5 Portfolio
    • ETF SECTOR ROTATION
      • ETF Sector Portfolio
  • Markets
    • US MARKET
      • Commodities
      • Energy
      • Precious Metals
      • Volatility
    • GLOBAL MARKETS
      • MARKET INDICES
      • ECONOMIC CALENDAR
      • FOREX HEAT MAP
      • FOREX CROSS RATES
      • CRYPTOCURRENCY MARKET
    • DASHBOARD
    • IDEAS
  • Investing
    • FORUM
  • Resources
    • ARTICLES
    • WEEKLY STOCK
    • RETIREMENT PLANNING
    • BLOGROLL
    • FAQ
  • About
    • CONTACT US
    • HOW TO WIN
    • #1 AT STOCKCHARTS
  • Log In
  • Subscribe

August 2, 2016

Tuesday Aug 2, 2016

08/02/2016 Daily Commentary: Markets finally broke the Pink Lines (10-day avgs.), and some selling came in. The Strongest Leaders should go up once more.   The S&P 500 should drop down soon to test Support around 2130.

Bonds must make Higher Highs soon, or they will correct.  Gold Miners made a Higher High today, but are very over-bought.

Crude Oil continued lower to re-test the February Lows… Oil Stocks are not dropping much, telling us Oil could be bottoming soon.

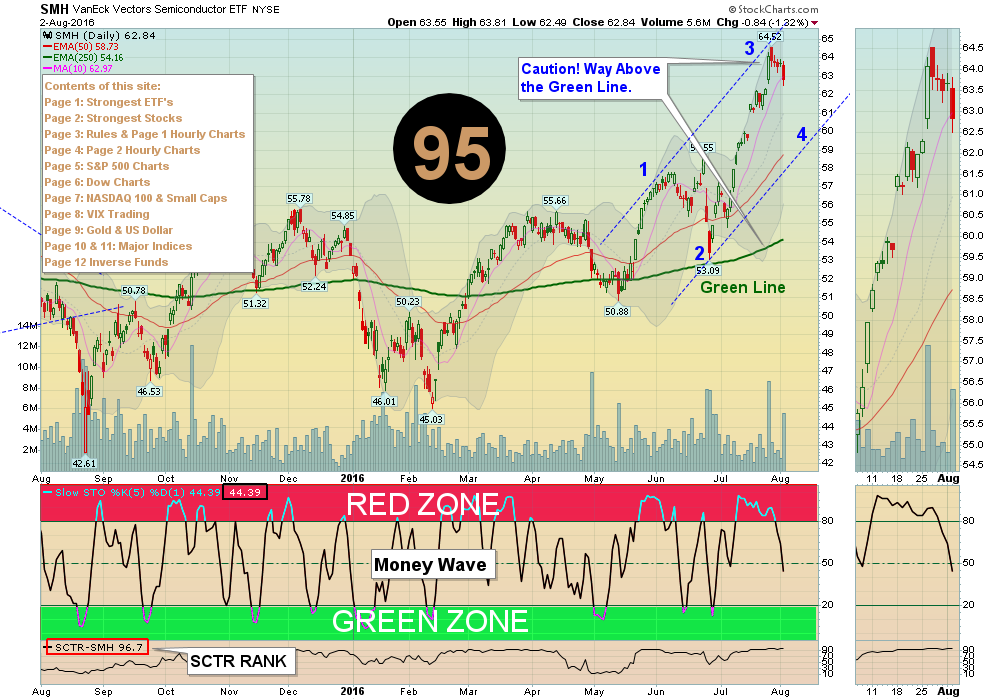
Current Open Positions  Most Open Positions are in the Red Zones, so we have set tight Sell Stops. Please check here.

Wait for Money Wave Buys that return to the Green Zones. We are watching AMAT & SID.
We will email or text you when they are ready.

When Markets are tired like they are now, either take quick gains from Money Wave Pops, or STAY IN CASH & WAIT for a larger correction. Many Funds are having trouble staying Above 90 Relative Strength.

“Real Time” Charts for Today

Buyers have finally run out of Money!

Posted By AbovetheGreenLine at 7:48 pm Leave a Comment

Leave a Reply Cancel reply

You must be logged in to post a comment.

Voted #1 at Stock Charts

SH Chart
Inverse S&P 500 Fund (SH) will have a Money Wave Buy today.

Help Us Help Animals

Help Us Help Animals

Recent Comments

  • Green Line Weekly Sep 3, 2023 – Omni Legal on Green Line Weekly Sep 3, 2023
  • AbovetheGreenLine on Green Line Weekly Aug 27, 2023
  • lbrodt on Green Line Weekly Aug 27, 2023
  • Mitch Van Zelfden on Money Wave Alert! Jul 31, 2023
  • AbovetheGreenLine on Money Wave Alert! Jul 31, 2023

Become a Green Liner!

Help me make more Money in the Stock Market.

Above the Green Line

ON ATGL

  • Weekly Commentary
  • Intraday Buy / Sells
  • Day Trade Setup

STRATEGIES

  • Swing Trading
  • Dividend Growth
  • ETF Sector Rotation
  • Dogs of the Dow

HELP

  • ATGL Trading Rules
  • FAQ
  • Account Maintenance
  • Contact US

© Copyright 2021 · AboveTheGreenLine.com · All Rights Reserved · Privacy · Terms · Contact · WatchList · Current