Above the Green Line -01
  • Market Insights
        • Commentary
          • Daily
          • Weekly
        • BUY / SELL SIGNALS
          • Trade Posts
          • Recent Trade Alerts
          • Recent Day Trades
        • BLOGROLL
          • Dividend Growth Blog
          • ETF Sector Blog
          • Dow Dogs
          • TPOW Blog
  • Strategies
        • SWING TRADING
          • Current Positions
          • Watchlists
          • Closed Positions
          • Candidates - TOP 100
          • Specialty Stocks
        • WEEKLY STOCK PICK
          • TPOW Charts
          • TPOW Performance
          • TPOW Strategy Guide
          • TPOW Performance Dashboard
          • Why Weekly Trading Works
        • DAY TRADING
          • Watch List
        • ATGL DASHBOARD
        • ETF STRATEGIES
          • ETF Sector Rotation
          • ETF Sector Portfolio
        • DIVIDEND GROWTH
          • Dividend Growth Portfolio
          • Dividend Calendar
        • DOGS OF THE DOW
          • Dogs of the Dow Portfolio
          • DOW 5 Portfolio
  • Markets
        • US MARKET
          • Commodities
          • Energy
          • Precious Metals
          • Volatility
        • GLOBAL MARKETS
          • Market Indices
          • Economic Calendar
          • FOREX Heat Map
          • FOREX Cross Rates
          • Crypto Currency Market
  • Investing
    • Discord Community
    • Dashboard
  • Resources
        • ARTICLES
          • Dividend Growth Model Articles
          • ETF Articles
          • Investment Strategies Articles
          • Market and Economic Insights
          • Stock Trade Articles
          • Stock Reviews
        • TOOLS
          • Stock Scanners
          • Charting Software
          • Brokerage Firms
          • Stocks We Review
        • STOCK CHARTS
          • Key Components
          • Reading Charts
          • Drawing Stock Charts
          • Identifying Trends
        • RETIREMENT PLANNING
  • About
    • Contact Us
    • How to Win
    • #1 At Stockcharts
    • Disclaimer
    • FAQ
  • Log In
  • Subscribe

Trade Signals

Above the Green Line presents both daily and weekly posts to its members highlighting Investment News and Trade alerts.

March 4, 2019

Money Wave Alert! Mar 4, 2019

DIA Chart

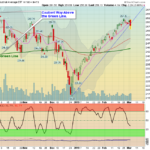
  Markets were down today as several Indices slipped below the Pink Lines (10-day avgs.) to create Short Term Sell Signals. Support on the  S&P 500 is 2764. The Leaders are quickly coming down from the Red Zones for Money Wave Buy … [Read more...]

March 1, 2019

Money Wave Alert! Mar 1, 2019

SPX Chart

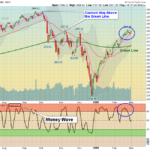
  Markets were up today and the S&P 500 was able to bounce up from the Pink Line (10-day avg.) of 2787 to avoid a Short Term Sell Signal. Now the S&P 500 needs to exceed Monday's high of 2813. Markets are over-bought again, as many … [Read more...]

February 28, 2019

Money Wave Alert! Feb 28, 2019

SPX 60-min

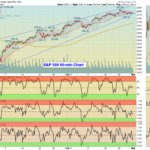
  Markets were down slightly today and the S&P 500 needs to bounce up from the Pink Line (10-day avg.) of 2782 to avoid a Short Term Sell Signal. Maybe another bounce coming tomorrow. Markets are over-bought again, as many Leaders were … [Read more...]

February 27, 2019

Money Wave Alert! Feb 27, 2019

SPX Chart

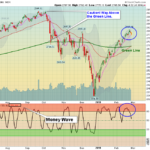
  Markets were down today and the S&P 500 needs to bounce up from the Pink Line (10-day avg.) of 2778 to avoid a Short Term Sell Signal.  Markets were over-bought again, as many Leaders were back up in the Red Zones (probably too late … [Read more...]

February 26, 2019

Money Wave Alert! Feb 26, 2019

SBUX Chart

  Markets  were up slightly today as the Markets are about 1/2 way back up to yesterday's High. Volume is low as Buyers don't have much News to react to, and Sellers don't have a reason to exit.   Markets are over-bought again, as many … [Read more...]

  • « Previous Page
  • 1
  • …
  • 354
  • 355
  • 356
  • 357
  • 358
  • …
  • 483
  • Next Page »

Subscribe to Our Newsletter

AGL Logo

Get our eBook Now!

Candlestick - A Swing Traders Friend

We don’t spam! Read our privacy policy for more info.

You’ve been successfully subscribed to our newsletter!

Voted #1 at Stock Charts

SH Chart
Inverse S&P 500 Fund (SH) will have a Money Wave Buy today.

Help Us Help Animals

Help Us Help Animals

Recent Comments

  • ATGL Weekly Money Flow - 2026-02-08 on ATGL Top Pick of the Week! Jan 25, 2026
  • ATGL Weekly Money Flow - 2026-01-25 on ATGL Top Pick of the Week! Jan 11, 2026
  • ATGL Weekly Money Flow - 2025-12-28 on ATGL Top Pick of the Week Dec 21, 2025
  • Inside Bar Trading Strategy: Improve Timing and Wins on Price Action Trading: Mastering the Art of Reading the Market Without Indicators
  • Breakaway Gap Explained: Identify High-Probability Setups on Identifying Market Exhaustion Signals for Smarter Trading Decisions

Become a Green Liner!

Help me make more Money in the Stock Market.

ON ATGL

  • DashBoard
  • Weekly Commentary
  • Daily Buy / Sell Signals
  • Day Trade Setup
  • Trading Rooms

Design & Develop By Pixelvect

STRATEGIES

  • Swing Trading
  • ATGL Pick of the Week
  • Dividend Growth
  • ETF Sector Rotation
  • Dogs of the Dow

HELP

  • ATGL Trading Rules
  • FAQ
  • Account Maintenance
  • Contact US
  • Join

FOLLOW US

Instagram Linkedin Twitter Facebook

© COPYRIGHT 2024 · ABOVETHEGREENLINE.COM · ALL RIGHTS RESERVED · PRIVACY · TERMS · CONTACT · WATCHLIST · CURRENT