
Above the Green Line presents both daily and weekly posts to its members highlighting Investment News and Trade alerts.
Money Wave Alert! Mar 25, 2021
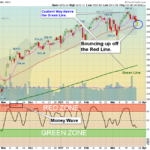
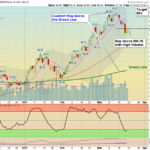
Markets were higher today as Tech & Momentum Stocks firmed up on mild Buying. Many of the Leaders are about to have Money Wave Buy Signals soon. Try to Buy Investments that are still above the Red Lines (50-day avgs.) as they tend to bounce … [Read more...]
Money Wave Alert! Mar 24, 2021
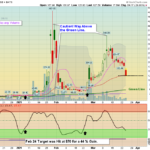
Markets were mixed today as Tech & Momentum Stocks continued to be under selling pressure. Oil Stocks firmed up, but Volume was low everywhere. Some are now worried about Economic weakness, but the Leaders were just very over-bought. More Money … [Read more...]
Money Wave Alert! Mar 23, 2021
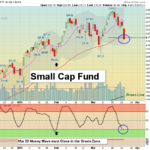
Markets were lower today as Retail and Oil Stocks dumped. Some are now worried about Economic weakness, but the Leaders were just very over-bought. The Market had no power left as many Investors were reluctant to Buy up at the Highs (Tammy spent … [Read more...]
Money Wave Alert! Mar 22, 2021
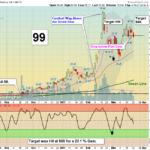
Markets were higher today on mild buying as the Indices attempt to rally back up to re-test the recent Highs. The Market has no power left as many Investors are reluctant to Buy up at these levels. More Money Wave Buy Signals soon, but the Pops have … [Read more...]
Money Wave Alert! Mar 19, 2021
Markets were mixed today on low Spring Break Volume. The Market does not have many Sellers with the FED Printing, but it also does not seem to have much New Money to Buy up at these levels. Money Wave Buy Signal Pops have been weak recently. The … [Read more...]
- « Previous Page
- 1
- …
- 250
- 251
- 252
- 253
- 254
- …
- 484
- Next Page »