
Above the Green Line presents both daily and weekly posts to its members highlighting Investment News and Trade alerts.
Money Wave Alert! Apr 9, 2021
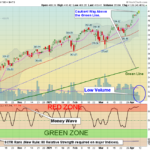
Markets were up slightly again today, as most Investors won't Sell from FOMO (Fear OF Missing Out). It's very unusual for Markets to hold up like this on very Low Volume. But that's because most Investors are Bullish (AAII Sentiment is the Highest … [Read more...]
Money Wave Alert! Apr 8, 2021
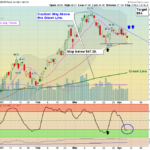
Markets were up slightly today, after popping up out of the 2 day sideways pattern. So far the burp up has been small on very Low Volume. The S&P 500 and DOW 30 Indices are on all time Highs, but the Small Caps and NASDAQ 100 Funds are struggling … [Read more...]
Money Wave Alert! Apr 7, 2021
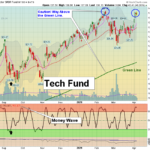
Markets were mixed again today, but have been going sideways for almost 2 days. This probably means that another quick burp up is coming with some Good News. The S&P 500 and DOW 30 Indices are near all time Highs again, but the Small Caps and … [Read more...]
Money Wave Alert! Apr 6, 2021
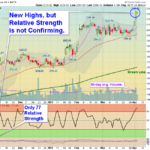
Markets were mixed to lower today after yesterday's rally where the S&P 500 and DOW 30 Indices made all time Highs again. The Small Caps and NASDAQ 100 Funds are struggling to catch up, and need to make New Highs also for this rally to continue. … [Read more...]
Money Wave Alert! Apr 5, 2021
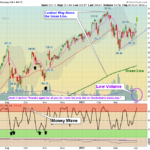
Markets were higher again today as the S&P 500 and DOW 30 Indices continued up to make all time Highs again. The Small Caps and NASDAQ 100 Funds are struggling to catch up. Most of the Leaders are quickly back up in the Red Zones (probably too … [Read more...]
- « Previous Page
- 1
- …
- 248
- 249
- 250
- 251
- 252
- …
- 484
- Next Page »