
Above the Green Line presents both daily and weekly posts to its members highlighting Investment News and Trade alerts.
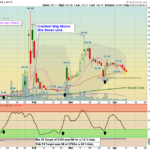
Money Wave Alert! Apr 16, 2021
Markets were mostly higher today as the Buying stampede of the Big Caps continued. FEAR is gone now and Tammy is spending all of her Money at the Highs on the Good News (Fed Printing and Low Interest Rates). Then we should see a larger pull-back. … [Read more...]
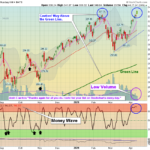
Money Wave Alert! Apr 15, 2021
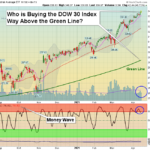
Markets are making History now that you will probably remember for the rest of your life. We are seeing a Buying stamped of the Big Caps that is running the Indices up day after day, but there is Low Volume... Then What? The DOW 30 Index, the S&P … [Read more...]
Money Wave Alert! Apr 14, 2021
Markets were slightly lower today as Big TECH took some profits. The DOW 30 Index and the S&P 500 made slightly Higher Highs, but NASDAQ 100 Fund was was down 1 %. Energy Stock finally had some nice "Short Covering" pops today. The Small Cap … [Read more...]
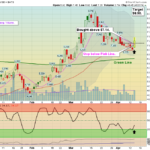
Money Wave Alert! Apr 13, 2021
Markets were slightly higher today as Big TECH moved up. The NASDAQ 100 Fund was finally able to make New Highs, but many lower priced Stocks are getting hit pretty hard. The Small Cap Fund is struggling to catch up, and needs to make New Highs … [Read more...]
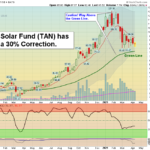
Money Wave Alert! Apr 12, 2021
Markets were slightly lower today, on mild profit taking. Many lower priced Stocks are getting hit pretty hard, and also Solar. The S&P 500 and DOW 30 Indices are near all time Highs, but the Small Caps and NASDAQ 100 Funds are struggling to … [Read more...]
- « Previous Page
- 1
- …
- 247
- 248
- 249
- 250
- 251
- …
- 484
- Next Page »