
Above the Green Line presents both daily and weekly posts to its members highlighting Investment News and Trade alerts.
Money Wave Alert! May 13, 2021
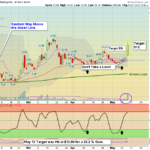
Markets bounced up today, as the DOW 30 Index and the S&P 500 have finally corrected down to their Red Lines (50-day avgs.) Now Investors are a little scared (FEAR), which is when we like to Buy soon. The DOW 30 is the strongest Index, and the … [Read more...]
Money Wave Alert! May 12, 2021
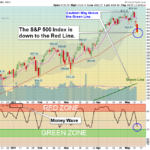
Markets were lower again today, as the DOW 30 Index and the S&P 500 are finally correcting down to their Red Lines (50-day avgs.) Now Investors are a little scared (FEAR), which is when we like to Buy soon. The DOW 30 is the strongest Index, and … [Read more...]
Money Wave Alert! May 11, 2021
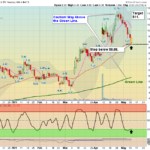
Markets were lower again today, as the broader markets got hit. The DOW 30 Index and the S&P 500 are finally correcting down towards their Red Lines (50-day avgs.) There were several Reversals today on the Momentum Stocks are they should be ready … [Read more...]
Money Wave Alert! May 10, 2021
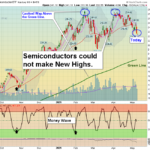
Markets were mostly lower today, as the weaker Tech Stocks got hit. The DOW 30 Index and the S&P 500 are too over bought to go much higher without a pullback. Trading would be better if these Indices could pull back down to the Red Lines (50-day … [Read more...]
Money Wave Alert! May 7, 2021
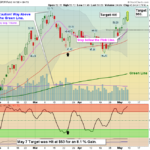
Markets were higher again today, as many Momentum Stocks finally popped up. The DOW 30 Index and the S&P 500 are back on the Highs, with the other Indices laggings. Volume is low as a warning not to Buy Way Above the Green Lines. Industrial … [Read more...]
- « Previous Page
- 1
- …
- 243
- 244
- 245
- 246
- 247
- …
- 483
- Next Page »