
Above the Green Line presents both daily and weekly posts to its members highlighting Investment News and Trade alerts.
Money Wave Alert! May 20, 2021
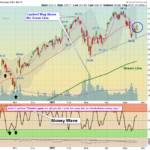
Markets bounced up today after three days of Selling. as the DOW 30 and S&P 500 Indices bounced up off the Red Lines (50-day avgs.) again. This could be a Bullish "W" Pattern back up to re-test the recent Highs. Then the DOW 30 Index and the … [Read more...]
Money Wave Alert! May 19, 2021
Markets were lower again today as the Indices are re-testing last week's Lows and the Red Lines (50-day avgs.). This could be setting up for a Bullish "W" Pattern back up if Selling Volume is low. Then the DOW 30 Index and the S&P … [Read more...]
Money Wave Alert! May 18, 2021
Markets were mostly lower again today on very low Selling Volume. The DOW 30 Index and the S&P 500 must make Higher Highs soon to avoid a "Double Top". Many Investments are quickly back up in the Red Zones (probably too late to Buy for the Short … [Read more...]
Money Wave Alert! May 17, 2021
Markets were mostly lower today, on very low Selling Volume. The DOW 30 Index and the S&P 500 must make Higher Highs soon to avoid a "Double Top". The weaker Indices NASDAQ 100 and Small Caps are struggling below the Red Lines as the Market … [Read more...]
Money Wave Alert! May 14, 2021
Markets bounced up again today, after the DOW 30 Index and the S&P 500 bounced up off their Red Lines (50-day avgs.). Now they must make Higher Highs to avoid a "Double Top". The weaker Indices NASDAQ 100 and Small Caps are still below the Red … [Read more...]
- « Previous Page
- 1
- …
- 242
- 243
- 244
- 245
- 246
- …
- 483
- Next Page »