
Above the Green Line presents both daily and weekly posts to its members highlighting Investment News and Trade alerts.
Money Wave Alert! Jun 25, 2021
Markets were higher again today as the S&P 500 was able to make New Highs, but the NASDAQ 100 was mixed. Investors seem to only care about liquidity in the Markets, but Buying was weak. Many of the Leaders are quickly back up in the Red Zones … [Read more...]
Money Wave Alert! Jun 24, 2021
Markets were higher again today as the S&P 500 and NASDAQ 100 Indices were able to make New Highs. Investors seem to only care about liquidity from the FED or borrowed by Congress (Infrastructure Bill is making progress today). Many of the … [Read more...]
Money Wave Alert! Jun 23, 2021
Markets were slightly higher today as the S&P 500 Index tries to make new Highs for this rally to continue. However, New Highs can be dangerous with Low Volume. The NASDAQ 100 Index was able to make New Highs today, but many of the Leaders are … [Read more...]
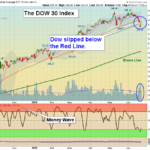
Money Wave Alert! Jun 22, 2021
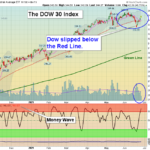
Markets were higher again today but the S&P 500 Index now must make new Highs for this rally to continue. The NASDAQ 100 Index was able to make New Highs today, but the DOW 30 Index has become weaker and is struggling to get back above the Red … [Read more...]
Money Wave Alert! Jun 21. 2021
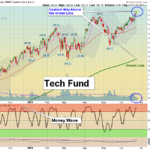
Markets were higher today as the S&P 500 Index bounced nicely up off the Red Line (50-day avg.) Now it must make new Highs for this rally to continue. The DOW 30 Index has become weaker and is still below the Red Line. But the NASDAQ 100 is now … [Read more...]
- « Previous Page
- 1
- …
- 237
- 238
- 239
- 240
- 241
- …
- 483
- Next Page »