
Above the Green Line presents both daily and weekly posts to its members highlighting Investment News and Trade alerts.
Money Wave Alert! Nov 1, 2021
Markets were mixed again today on very low Volume, because disciplined Investors don't normally Buy when the Indices are Way Above the Green Lines and on Highs. Smart Money is waiting on a pullback like we had 3 weeks ago. The Market seems to be … [Read more...]
Money Wave Alert! Oct 29, 2021
Markets were mixed today as the Indices are over-bought and up on the Highs. The Market seems to be waiting on the Spending Bill vote, possibly today, or this weekend. Many of the Leaders are back up in the Red Zones (probably too late to Buy for the … [Read more...]
Money Wave Alert! Oct 28, 2021
Markets were higher today as Investors have learned that the Gov't. Spending package might be reduced in half to $1.75 Trillion. The Market seems to be waiting on the Spending Bill vote, possibly tomorrow. AAPL & AMZN Earnings will be out today … [Read more...]
Money Wave Alert! Oct 27, 2021
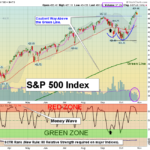
Markets were mixed today even though 80% of the Stocks have had higher than expected Earnings. But many of the Leaders are back up in the Red Zones (probably too late to Buy for the Short Term). The S&P 500 and DOW 30 Indices were able to stay … [Read more...]
Money Wave Alert! Oct 26, 2021
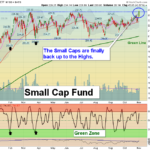
Markets were slightly higher again today as the S&P 500 and DOW 30 Indices were able to stay above the September Highs. Earnings are coming out, with some stocks popping to the upside. The NASDAQ 100 and Small Caps are still lagging, and the … [Read more...]
- « Previous Page
- 1
- …
- 219
- 220
- 221
- 222
- 223
- …
- 483
- Next Page »