
Above the Green Line presents both daily and weekly posts to its members highlighting Investment News and Trade alerts.
Money Wave Alert! Dec 14, 2021
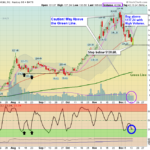
Markets were weaker again today on mild Selling Volume, and today some of the Big Tech got Hit. But then a rally came in as the S&P 500 Index was able to bounce up off the Red Line (50-day avg). More Sell Stops were triggered in the Open … [Read more...]
Money Wave Alert! Dec 13, 2021
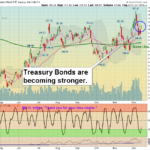
Markets were weaker today on mild Selling Volume, but many Momentum Stocks continued to get hit today. Several Sell Stops were triggered in the Open Positions List below. Many are waiting on the FED Meeting results on Wednesday. We need to see Higher … [Read more...]
Money Wave Alert! Dec 10, 2021
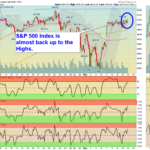
Markets were higher today but many of the very Strongest Leaders are quickly back up near their Highs (Resistance). We need to see Higher Volume to push through Resistance, but it was not there today. Soon the stronger S&P 500 and NASDAQ 100 … [Read more...]
Money Wave Alert! Dec 9, 2021
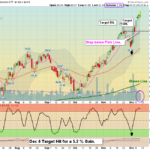
Markets were slightly weaker today after a sharp rally earlier this week. Soon the stronger S&P 500 and NASDAQ 100 Indices need to exceed the November Highs to remain Bullish. The weaker DOW 30, NYSE, and Small Cap Indices are not very far above … [Read more...]
Money Wave Alert! Dec 8, 2021
Markets were mixed again today after two strong rally days this week. Now the stronger S&P 500 and NASDAQ 100 Indices need to exceed the November Highs to remain Bullish. Last week there was plenty of Investor FEAR from a Virus, and now it is … [Read more...]
- « Previous Page
- 1
- …
- 213
- 214
- 215
- 216
- 217
- …
- 483
- Next Page »