
Above the Green Line presents both daily and weekly posts to its members highlighting Investment News and Trade alerts.
Money Wave Alert! Jan 4, 2022
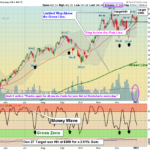
Markets were mixed today as the DOW 30 Index made a New High, but many of the Big Techs were weaker. The NASDAQ 100 Fund slipped below the Pink Line (10-day avg.) this morning, but might rally enough on the Close to avoid a Short Term Sell Signal. … [Read more...]
Money Wave Alert! Jan 3, 2022
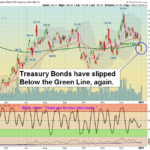
Markets were higher today as many of the Leaders had corrected down near the Pink Lines (10-day avgs.) on Friday and then bounced up to avoid a Short Term Sell Signals. However, Treasury Bonds dumped down 2 % today on renewed Big Gov't. Borrowing … [Read more...]
Money Wave Alert! Dec 31, 2021

Markets were up slightly today as nobody wants to Sell, and the Institutions want to hold the Markets up to get Big End of Year Bonuses... The strongest Leaders are staying up in the Red Zones (probably too late to Buy for the Short Term). Buying … [Read more...]
Money Wave Alert! Dec 30, 2021
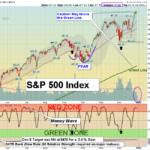
Markets were up slightly today as nobody wants to Sell, and the Institutions want to hold the Markets up to get Big End of Year Bonuses... The strongest Leaders are staying up in the Red Zones (probably too late to Buy for the Short Term). Buying … [Read more...]
Money Wave Alert! Dec 29, 2021
Markets were up slightly today as the strongest Leaders are staying up in the Red Zones (probably too late to Buy for the Short Term). Nobody wants to Sell, as the Institutions are gone for the Holidays. The S&P 500 Index and DOW 30 were able to … [Read more...]
- « Previous Page
- 1
- …
- 210
- 211
- 212
- 213
- 214
- …
- 483
- Next Page »