
Above the Green Line presents both daily and weekly posts to its members highlighting Investment News and Trade alerts.
Money Wave Alert! Nov 18, 2022
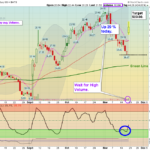
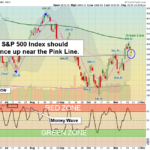
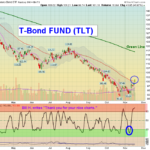
Markets were higher today as the Indices were able to bounce up near the Pink Lines (10-day avgs.) Now they need to Close higher than on Tuesday, and try to Close Above the Green Lines, like the DOW 30 Index has done. Bonds are back up to the … [Read more...]
Money Wave Alert! Nov 17, 2022
Markets were lower again today as the Indices are returning back down to the Pink Lines (10-day avgs.) Then they should bounce up again soon and try to Close Above the Green Lines, like the DOW 30 Index has done. The Stock Indices were extended … [Read more...]
Money Wave Alert! Nov 16, 2022
Markets were lower today as the weak Tech stocks had some mild profit taking. The NASDAQ 100 Index is still below the Green Line. The Stock Indices are extended from returning back up near the Green Lines. The weak hand investors were flushed out … [Read more...]
Money Wave Alert! Nov 15, 2022
Markets were "gapped up" today on more lower Inflation news. The weaker Big Tech stocks were able to go higher, as the NASDAQ 100 Index is still below the Green Line. The Indices are extended from "Good News Buying" from the lower Inflation … [Read more...]
Money Wave Alert! Nov 14, 2022
Markets were mixed today as the Indices are extended from "Good News Buying" from the lower Inflation number. The S&P 500 is almost back up to the Green Line. Be careful buying now as the DOW 30 Index has just bounced up 5000 points in a month. … [Read more...]
- « Previous Page
- 1
- …
- 164
- 165
- 166
- 167
- 168
- …
- 483
- Next Page »