
Above the Green Line presents both daily and weekly posts to its members highlighting Investment News and Trade alerts.
Money Wave Alert! Dec 19, 2022
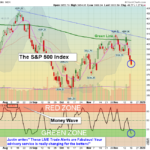
Markets were lower again today on continued mild Selling from FEAR of an Economic slow down because of FED Tightening. The major Indices are quickly back down in the Green Zones (probably too late to Sell for the short Term) for bounces soon. The … [Read more...]
Money Wave Alert! Dec 16, 2022
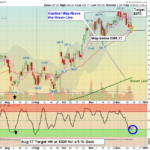
Markets were lower again today on continued FEAR Selling about the FED Tightening. The major Indices are quickly back down in the Green Zones (probably too late to Sell for the short Term) for bounces soon. Eventually the Fed will slow the Economy … [Read more...]
Money Wave Alert! Dec 15, 2022
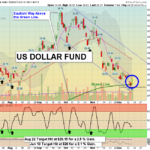
Markets were lower today on more reaction to the FED raising short term Interest Rates yesterday. Today's drop is a warning to the FED that continued tightening could cause Stocks to go lower. Eventually the Fed will slow the Economy down so much … [Read more...]
Money Wave Alert! Dec 14, 2022
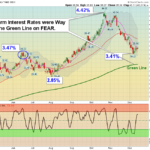
Markets were lower today as the FED raised the short term Interest Rates 1/2 point to 4.25%, as expected. The FED continued to talk about further tightening, which is not want the Market wants to hear. Eventually the Fed will slow the Economy down so … [Read more...]
Money Wave Alert! Dec 13, 2022
Markets "Gapped Up" about 800 DOW points this morning on Good News, and then went negative for a while. What a wild day. There were several more Buy Signals today, but the Volume was not good on most. More Buy Signals soon for a quick bounce to … [Read more...]
- « Previous Page
- 1
- …
- 160
- 161
- 162
- 163
- 164
- …
- 483
- Next Page »