
Above the Green Line presents both daily and weekly posts to its members highlighting Investment News and Trade alerts.
Money Wave Alert! Jan 11, 2023
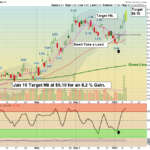
Markets were higher again today as the Leaders are hitting more Targets (see below). Volume was low, and several Inverse Funds below that actually meet the Green Line Rules should have Buy Signals soon. Slowly the high Interest Rates are causing … [Read more...]
Money Wave Alert! Jan 10, 2023
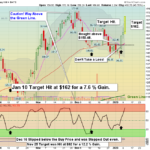
Markets were slightly higher today but the Volume was low. Many Investors cannot decide what to do. Commodities were weak on slowing Inflation. Slowly the high Interest Rates are causing Inflation to slow down, which is why Bonds have been … [Read more...]
Money Wave Alert! Jan 9, 2023
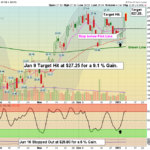
Markets started off higher today but faded near the Close. Three Stocks below reached their Targets on the rally this morning. Long term Interest Rates fell again on Inflation weakness. Slowly the high Interest Rates are causing Inflation to slow … [Read more...]
Money Wave Alert! Jan 6, 2023
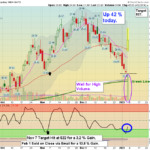
Markets were sharply higher today as long term Interest Rates fell on Inflation weakness. Lots of Short Covering as FEAR had many Shorting the Markets. Slowly the high Interest Rates are causing Inflation to slow down, which is why Bonds have been … [Read more...]
Money Wave Alert! Jan 5, 2023
Markets were lower today on low Volume as many investors are waiting on the FED to Stop Tightening.. Eventually the high Interest Rates will cause Inflation to slow down, which is why Bonds have been strengthing. Please be patient and wait for … [Read more...]
- « Previous Page
- 1
- …
- 157
- 158
- 159
- 160
- 161
- …
- 483
- Next Page »