
Above the Green Line presents both daily and weekly posts to its members highlighting Investment News and Trade alerts.
Money Wave Alert! May 5, 2023
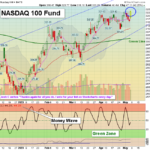
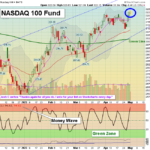
Markets were sharply higher today as the weak Regional Banks bounced up from being very over sold. Big Tech Stocks were strong, but the Buying Volume was not great. The NASDAQ 100 Index is right up near last week's high. Now the the S&P 500 … [Read more...]
Money Wave Alert! May 4, 2023
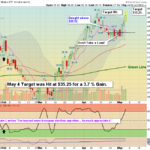
Markets were slightly lower again today as more Regional Banks dumped, as if they could be liquidated soon. Big Banks are buying the smaller ones... Markets are sideways, as 1/2 see a slowdown coming, and the other 1/2 do not (equilibrium). Now … [Read more...]
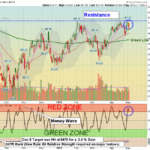
Money Wave Alert! May 3, 2023
Markets were slightly lower today after the FED raised short term Interest Rates by another 1/4 point. Traders were disappointed as the FED would not say that Tightening is finished. Markets are sideways, as 1/2 see a slowdown coming, and the other … [Read more...]
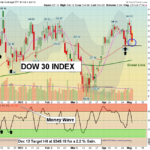
Money Wave Alert! May 2, 2023
Markets were lower today on normal profit taking and Bank worries. The FED should raise short term Interest Rates another 1/4 point tomorrow. No conviction from buyers, or else they are out of Money. Now the the S&P 500 and the DOW 30 Indices … [Read more...]
Money Wave Alert! May 1, 2023
Markets were mixed today on continued low Volume trading, The FED should raise short term Interest Rates another 1/4 point on Wednesday. No conviction from buyers, or else they are out of Money. Now the the S&P 500 and the DOW 30 Indices need to … [Read more...]
- « Previous Page
- 1
- …
- 141
- 142
- 143
- 144
- 145
- …
- 483
- Next Page »