
Above the Green Line presents both daily and weekly posts to its members highlighting Investment News and Trade alerts.
Money Wave Alert! Jul 17, 2023
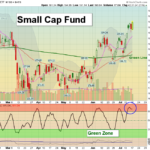
Markets slightly higher today on continued low Volume. The S&P 500 & Semiconductor Funds were able to make higher highs once again (Bullish). But not the weaker DOW 30 or Small Cap Indices. The Pink Lines (10-day averages) are Support on … [Read more...]
Money Wave Alert! Jul 14, 2023
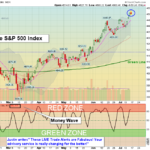
Markets were mixed today after rallying earlier. Then the Big Techs and Semis had some profit taking. The S&P 500 & NASDAQ 100 Funds were able to make higher highs again (Bullish). But not the weaker DOW 30 or Small Cap Indices. The Pink … [Read more...]
Money Wave Alert! Jul 13. 2023
Markets were higher today on more lower Inflation numbers, and the Buying Stampede continued. The S&P 500 & NASDAQ 100 Funds were able to make higher highs again (Bullish). But not the weaker DOW 30 or Small Cap Indices. The Pink Lines … [Read more...]
Money Wave Alert! Jul 12, 2023
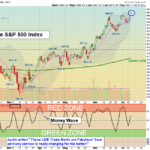
Markets were higher today on lower Inflation numbers, and the S&P 500 & NASDAQ 100 Funds were able to make slightly higher highs (Bullish). The Pink Lines (10-day averages) are Support on these Indices to avoid short term Sell Signals. The … [Read more...]
Money Wave Alert! Jul 11, 2023
Markets were slightly today as the S&P 500 & NASDAQ 100 Funds are still trying to hold up above the Pink Lines (10-day averages) to avoid short term Sell Signals. Both Indices need to make higher high soon for the rally since March to … [Read more...]
- « Previous Page
- 1
- …
- 131
- 132
- 133
- 134
- 135
- …
- 483
- Next Page »