Above the Green Line -01
  • Market Insights
        • Commentary
          • Daily
          • Weekly
        • BUY / SELL SIGNALS
          • Trade Posts
          • Recent Trade Alerts
          • Recent Day Trades
        • BLOGROLL
          • Dividend Growth Blog
          • ETF Sector Blog
          • Dow Dogs
          • TPOW Blog
  • Strategies
        • SWING TRADING
          • Current Positions
          • Watchlists
          • Closed Positions
          • Candidates - TOP 100
          • Specialty Stocks
        • WEEKLY STOCK PICK
          • TPOW Charts
          • TPOW Performance
          • TPOW Strategy Guide
          • TPOW Performance Dashboard
        • DAY TRADING
          • Watch List
        • ATGL DASHBOARD
        • ETF STRATEGIES
          • ETF Sector Rotation
          • ETF Sector Portfolio
        • DIVIDEND GROWTH
          • Dividend Growth Portfolio
          • Dividend Calendar
        • DOGS OF THE DOW
          • Dogs of the Dow Portfolio
          • DOW 5 Portfolio
  • Markets
        • US MARKET
          • Commodities
          • Energy
          • Precious Metals
          • Volatility
        • GLOBAL MARKETS
          • Market Indices
          • Economic Calendar
          • FOREX Heat Map
          • FOREX Cross Rates
          • Crypto Currency Market
  • Investing
    • Discord Community
    • Dashboard
  • Resources
        • ARTICLES
          • Dividend Growth Model Articles
          • ETF Articles
          • Investment Strategies Articles
          • Market and Economic Insights
          • Stock Trade Articles
          • Stock Reviews
        • TOOLS
          • Stock Scanners
          • Charting Software
          • Brokerage Firms
        • STOCK CHARTS
          • Key Components
          • Reading Charts
          • Drawing Stock Charts
          • Identifying Trends
        • RETIREMENT PLANNING
  • About
    • Contact Us
    • How to Win
    • #1 At Stockcharts
    • Disclaimer
    • FAQ
  • Log In
  • Subscribe

Trade Signals

Above the Green Line presents both daily and weekly posts to its members highlighting Investment News and Trade alerts.
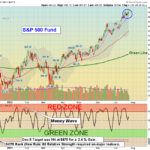
March 6, 2023

Money Wave Alert! Mar 6, 2023

SPX Chart

  Markets were mixed today, after rallying up in the morning. Eventually long term Interest Rates perked back up and Bond prices fell. The Leaders and Indices are quickly back up in the Red Zones (probably too late to Buy for the short … [Read more...]

March 3, 2023

Money Wave Alert! Mar 3, 2023

ARDX Chart

Markets were higher again today, as long term Interest Rates fell and Bond prices to firmed up. The Buying interest on Stocks was low until Interest Rates stalled out. Bonds could be firming up soon. The Market has been correcting the panic Buying … [Read more...]

March 2, 2023

Money Wave Alert! Mar 2, 2023

SPX Chart

Markets were higher today, as the big 30 DOW stocks rallied. Investors are waiting for long Term Bond prices to firm up (lower Interest Rates). But Bonds Gapped Down today on panic buying (which probably means a Selling Climax soon). The Buying … [Read more...]

March 1, 2023

Money Wave Alert! Mar 1, 2023

TLT Chat

Markets were mixed to lower again today, as Investors want to see long Term Bond prices firm up (lower Interest Rates). The Buying interest has currently dropped with the higher Interest Rates. The Leaders and Indices have popped up out of the Green … [Read more...]

February 28, 2023

Money Wave Alert! Feb 28, 2023

TNX Chart

Markets were mixed to lower today, as the Buying interest has currently dropped with the higher Interest Rates. The Leaders and Indices have popped up out of the Green Zones (probably too late to Sell for the short term) for more Buy Signals, but the … [Read more...]

  • « Previous Page
  • 1
  • …
  • 129
  • 130
  • 131
  • 132
  • 133
  • …
  • 462
  • Next Page »

Subscribe to Our Newsletter

AGL Logo

Get our eBook Now!

Candlestick - A Swing Traders Friend

We don’t spam! Read our privacy policy for more info.

You’ve been successfully subscribed to our newsletter!

Voted #1 at Stock Charts

SH Chart
Inverse S&P 500 Fund (SH) will have a Money Wave Buy today.

Help Us Help Animals

Help Us Help Animals

Recent Comments

  • What Is a Calendar Spread and How to Trade It on IWM vs SPY: An ETF Comparison Analysis
  • Liquidity Risk in Stock Market: What It Is & Why It Matters on Swing Trading Risk Management: Tips To Safeguard Your Profits
  • Breakout Trading Strategies That Can Boost Your Gains on 7 Day Trading Strategies for New Investors
  • What the Descending Staircase Pattern Tells You About the Market on Bull vs. Bear Market: An Investor’s Guide to Market Phases
  • Want to Protect Your Capital? Start With Better Position Sizing on Risk Management in Trading: Tools and Techniques

Become a Green Liner!

Help me make more Money in the Stock Market.

ON ATGL

  • DashBoard
  • Weekly Commentary
  • Daily Buy / Sell Signals
  • Day Trade Setup
  • Trading Rooms

Design & Develop By Pixelvect

STRATEGIES

  • Swing Trading
  • ATGL Pick of the Week
  • Dividend Growth
  • ETF Sector Rotation
  • Dogs of the Dow

HELP

  • ATGL Trading Rules
  • FAQ
  • Account Maintenance
  • Contact US
  • Join

FOLLOW US

Instagram Linkedin Twitter Facebook

© COPYRIGHT 2024 · ABOVETHEGREENLINE.COM · ALL RIGHTS RESERVED · PRIVACY · TERMS · CONTACT · WATCHLIST · CURRENT