
Above the Green Line presents both daily and weekly posts to its members highlighting Investment News and Trade alerts.
Money Wave Alert! Aug 14, 2023
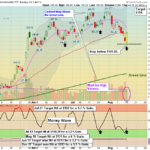
Markets were mostly higher today as the Semiconductors & Techs finally popped up. The Leaders have come down from the highs to Buy again soon.. Many of the Leaders are back down in the Green Zones (probably too late to Sell for the short … [Read more...]
Money Wave Alert! Aug 11, 2023
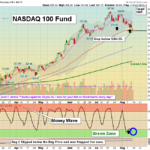
Markets were mixed again today as the Indices as still correcting down from the recent highs. The Semiconductors & Tech are still under pressure. The Leaders have come down from the highs to Buy again soon.. Many of the Leaders are back down … [Read more...]
Money Wave Alert! Aug 10, 2023
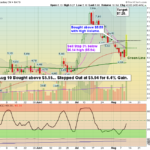
Markets were mixed today as the Indices went back down and the weaker ones fell below Friday's lows (Techs & Small Caps). The Leaders have come down from the highs to Buy again soon.. Many of the Leaders are back down in the Green Zones … [Read more...]
Money Wave Alert! Aug 9, 2023
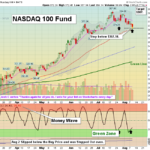
Markets were mostly lower today as the Indices went back down and the weaker ones fell below Friday's lows (Techs & Small Caps). The Leaders have come down from the highs to Buy again soon.. Many of the Leaders are back down in the Green Zones … [Read more...]
Money Wave Alert! Aug 8, 2023
Markets were lower today as the Indices went back down to retest Friday's lows. The Leaders have come down from the highs to Buy again soon.. Many of the Leaders are back down in the Green Zones (probably too late to Sell for the short term). … [Read more...]
- « Previous Page
- 1
- …
- 127
- 128
- 129
- 130
- 131
- …
- 483
- Next Page »