
Above the Green Line presents both daily and weekly posts to its members highlighting Investment News and Trade alerts.
Money Wave Alert! Aug 21, 2023
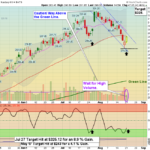
Markets were mostly higher today as some of the Big Tech stocks surged up on Short Covering. Bonds were slightly lower, but are near Support. They need to rally soon to help the Tech Stocks (Techs don't like high long term Interest Rates) . Bonds … [Read more...]
Money Wave Alert! Aug 18, 2023
Markets were mixed today after yesterday's dump. Bonds stopped at Support, but need to rally soon to help the Tech Stocks (Techs don't like high long term Interest Rates) . Bonds bounced at this Support in Oct 2022, and then the S&P 500 rallied … [Read more...]
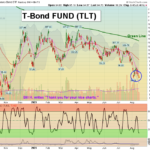
Money Wave Alert! Aug 17, 2023
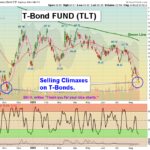
Markets dumped down again today as Bonds continued lower, causing higher long term Interest Rates. Bonds are near the Support of Oct 2022, and then they bounced and the S&P 500 rallied 15%. The Semiconductors are holding up better this time. The … [Read more...]
Money Wave Alert! Aug 16, 2023
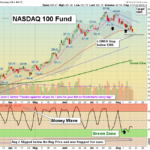
Markets were lower again today as Bonds continued lower, causing higher long term Interest Rates. The Semiconductors & Techs held up better this time. The Leaders have come down from the highs to Buy again soon.. Many of the Leaders are back … [Read more...]
Money Wave Alert! Aug 15, 2023
Markets were lower today as Bonds continued back down, causing higher long term Interest Rates. The Semiconductors & Techs held up better this time. The Leaders have come down from the highs to Buy again soon.. Many of the Leaders are back … [Read more...]
- « Previous Page
- 1
- …
- 126
- 127
- 128
- 129
- 130
- …
- 483
- Next Page »