By Andrew Stowers
Updated June 30, 2026
RSI above 70 is not a sell signal. In a strong uptrend, RSI staying above 70 for days or weeks is confirmation that momentum is sustained — traders who short every move to 70 in a bull market lose consistently.
The same applies in reverse: RSI below 30 in a confirmed downtrend can continue to 20, 15, and lower. The overbought/oversold levels are context-dependent signals, not automatic entries.
This guide provides five specific RSI trading strategies — each with exact entry conditions, the required confirmation, and the stop placement rule — built around the core principle that RSI works best as one component of a multi-factor system, not as a standalone trigger. To learn more about investment strategies, we have an in-depth Investment Strategy Guide that we highly encourage you to look over after reading this article to see how this all fits into the bigger picture.
RSI as a Strategy Tool: Beyond Overbought and Oversold
| The Five RSI Strategies
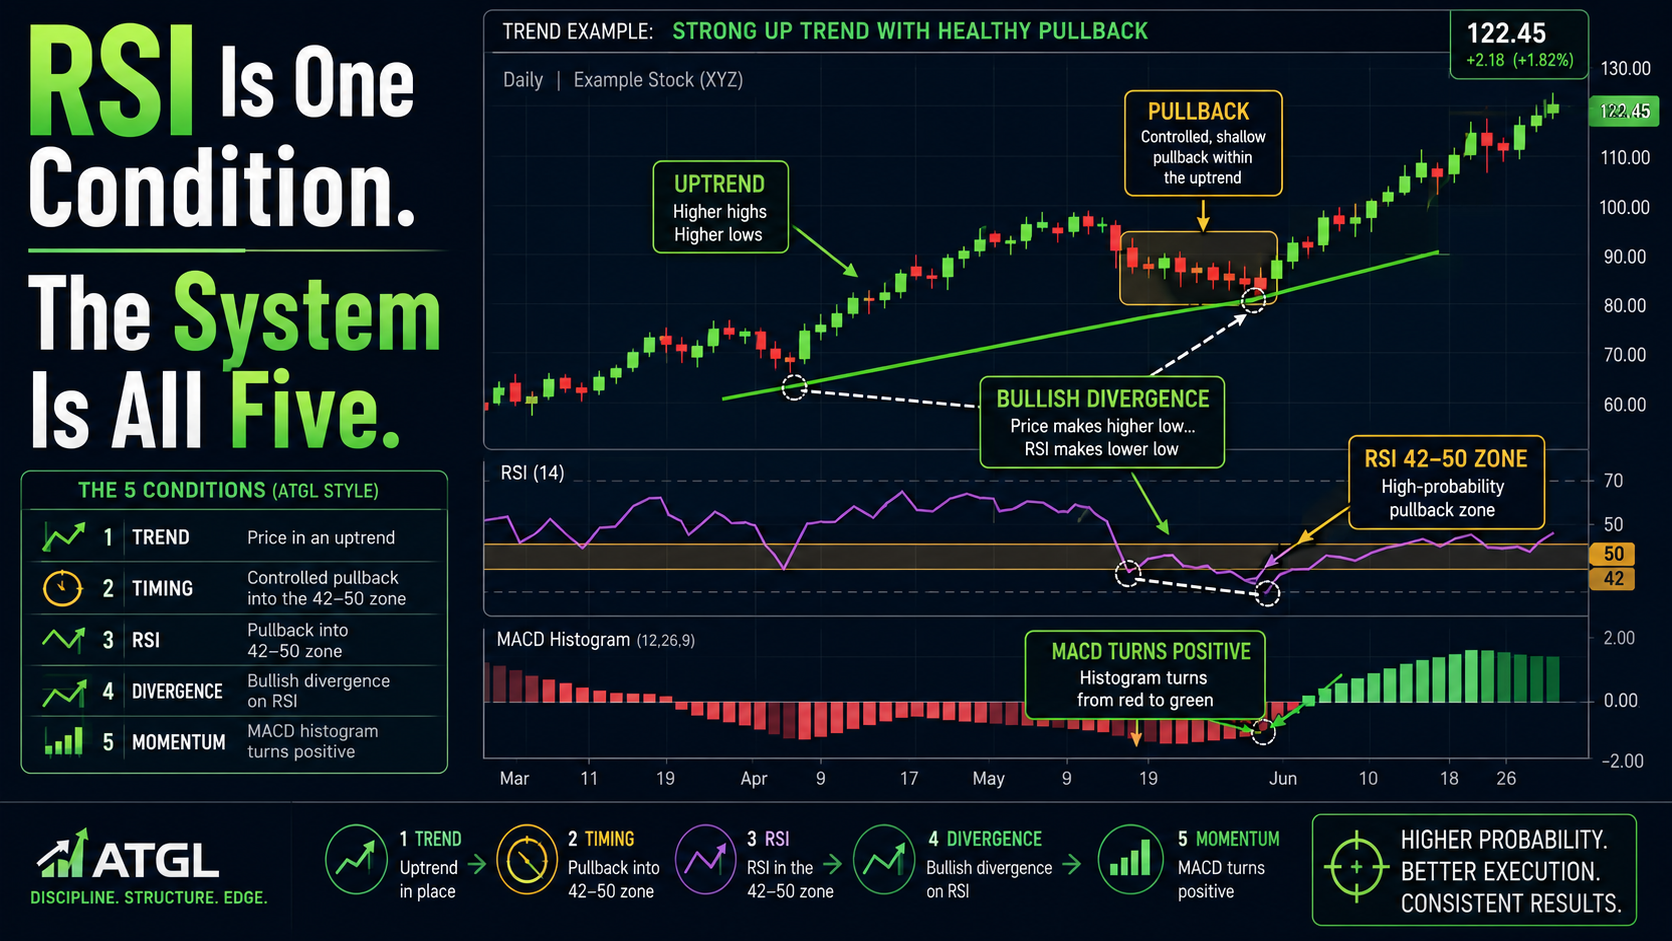
(1) Overbought/oversold with trend context, (2) Bullish and bearish divergence, (3) RSI trendline breaks, (4) RSI failure swings, (5) RSI with MACD and VWAP confluence. Each requires specific conditions and confirmation — none works as a standalone signal. |
RSI (Relative Strength Index) is a momentum oscillator that measures the speed and magnitude of recent price changes on a 0-100 scale. J. Welles Wilder’s formula compares average gains to average losses over a specified period (default 14) to produce a smooth, lagging momentum indicator.
The Three Strategic Roles RSI Plays
Momentum confirmation: RSI above 50 and rising = bullish momentum; below 50 and falling = bearish momentum; this role is most reliable and most underused.
Reversal warning: divergence between price and RSI, and the failure swing pattern, signal momentum exhaustion before price reverses — the most powerful but requires confirmation.
Entry timing: RSI pullbacks to the 40-55 zone in an established trend provide lower-risk re-entry points — the stock is in a trend but momentum has temporarily cooled without reversing.
The Context Requirement
The most common RSI mistake is treating overbought/oversold as absolute signals regardless of trend context. In a strong uptrend, RSI can remain above 70 for extended periods — this is trend confirmation, not reversal warning. RSI above 70 only signals a potential reversal when accompanied by divergence or a failure swing. In a rangebound market, the same reading is a meaningful reversal warning.
Note: ATGL’s relative strength index guide covers the indicator’s full mechanics and calculation. This article builds on that foundation with five specific strategy applications.
RSI Settings: The Right Period for Your Timeframe
The 14-period RSI is the default, but optimal settings vary with trading style and timeframe.
| Timeframe | Chart | Recommended Period | Trade-off |
|---|---|---|---|
| Day trading | 1-5 min | 9-period | Faster, more signals, more noise |
| Swing trading | Daily | 14-period (standard) | Balanced: Wilder’s original default |
| Swing (smoother) | Daily | 21-period | Fewer signals, cleaner but slower |
| Position / trend | Weekly | 14-25 period | Long-horizon trend confirmation |
The period setting determines how quickly RSI responds to new price information. A 9-period RSI on a 5-minute chart recalculates over 45 minutes of data — responsive to intraday setups but prone to false signals. A 14-period daily RSI recalculates over approximately 3 trading weeks — smoother, more reliable for swing entries, but slower to signal.
Calibration through backtesting: the optimal period for a specific strategy and instrument is determinable by testing 9, 14, 21, and 25-period RSI against the same trade setup rules on historical data. Use the period that maximises the profit factor while maintaining acceptable trade frequency.
Strategy 1: Overbought/Oversold — The Context Requirements
The classic RSI strategy refined with the context requirements that separate reliable signals from false ones.
When Overbought/Oversold Works
- Rangebound markets where price oscillates between defined support and resistance — RSI reliably signals overextension at both extremes
- After parabolic, near-vertical price moves where RSI reaches 80-90+ and the extension is clearly unsustainable short-term
- RSI below 20-25 in a correction within a larger uptrend — the short-term decline has overshot
When Overbought/Oversold Fails
- Strong uptrends: RSI above 70 for weeks is trend confirmation, not reversal; shorting early is repeatedly painful
- Strong downtrends: RSI below 30 can continue lower — the oversold condition in a confirmed bear can persist for months
The Oversold Long Setup — Six Steps
- Step 1: identify that the broader trend is up or neutral — not a confirmed downtrend
- Step 2: RSI falls below 30 on a pullback within the trend
- Step 3: RSI crosses back above 30 (confirmation that the oversold condition is resolving)
- Step 4: price action confirmation — bullish candle (hammer, engulfing, or strong close above prior candle’s midpoint)
- Step 5: entry on the close of the confirming candle or open of the next candle
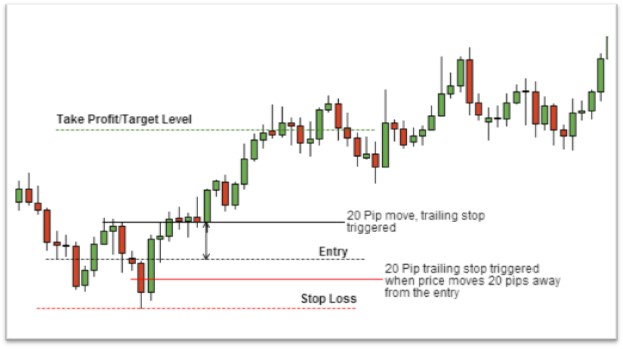
- Step 6: stop below the swing low made during the oversold RSI reading
The overbought short setup is the same process in reverse. Minimum reward-to-risk: 2:1 — the profit target must be at least twice the distance from entry to stop before taking the trade.
Strategy 2: RSI Divergence — Bullish, Bearish, and Hidden
| Divergence Is a Warning — Not an Immediate Entry
Divergence can persist for multiple price swings before resolving. Treat it as a warning that momentum is deteriorating, require price action confirmation, and never enter on the divergence alone. |
Bullish Regular Divergence
Identification: price makes a lower low; RSI makes a higher low over the same period. Interpretation: selling pressure is decelerating even as price falls further. Both RSI troughs should be below 40 (ideally below 30 on the oversold boundary). The line connecting the two RSI troughs slopes upward while the line connecting the price lows slopes downward.
Entry: wait for RSI to cross back above 30 or 40 AND a bullish reversal candle (hammer, engulfing, gap above the range). Stop: below the second (lower) price low — if price makes a new low and the divergence is invalidated, the position is wrong.
Bearish Regular Divergence
Identification: price makes a higher high; RSI makes a lower high. Both RSI peaks should be above 60 (ideally above 70). The RSI peak line slopes down while price slopes up.
Entry: RSI crosses back below 70 AND bearish reversal candle. Stop: above the second (higher) price high.
Hidden Divergence — Continuation Signals
Hidden bullish divergence (less common but powerful): price makes a higher low during a pullback in an uptrend, but RSI makes a lower low. Interpretation: the pullback is shallow despite RSI appearing weaker — the uptrend will likely continue. This is a continuation signal, not a reversal.
Hidden bearish divergence: price makes a lower high during a bounce in a downtrend, but RSI makes a higher high. Interpretation: the bounce is weak; the downtrend will likely resume. Also a continuation signal.
Hidden divergence setups are among the most powerful RSI applications and the least discussed in standard RSI content. They require trend identification on a higher timeframe before use.
Strategies 3 & 4: RSI Trendlines and Failure Swings
Strategy 3: RSI Trendlines
Draw trendlines directly on the RSI indicator — not the price chart. Connect RSI swing highs for a resistance trendline; connect RSI swing lows for a support trendline. A break of an RSI trendline often anticipates the price chart’s equivalent break by one to three candles, providing early warning before the price signal.
RSI trendline breaks are confirmed when RSI closes through the trendline level on a candle close — not just an intrabar touch. The signal is more reliable when the RSI trendline has been respected three or more times over a longer period. Most effective on daily charts for swing trade setups.
Strategy 4: RSI Failure Swings
The failure swing is one of the most reliable but least-known RSI reversal patterns. It does not require a comparison with price — the signal comes entirely from RSI’s own structure.
Bearish failure swing (top): (1) RSI rises above 70. (2) RSI pulls back below 70. (3) RSI rallies again but fails to exceed 70 — a lower high on RSI in overbought territory. (4) RSI then breaks below the low of the pullback. That break is the failure swing sell signal. It confirms that buying momentum was tested twice and found insufficient to reclaim overbought levels.
Bullish failure swing (bottom): (1) RSI falls below 30. (2) RSI bounces above 30. (3) RSI pulls back but holds above 30 — a higher low. (4) RSI then breaks above the bounce high. That break is the failure swing buy signal. Selling momentum failed to push RSI back into oversold on the retest.
Failure swings provide objective, RSI-only entry triggers that do not require identifying divergence on the price chart. The entry is the RSI level break in step 4; the stop is the most recent RSI structure low (for bullish) or high (for bearish) converted back to the corresponding price level.
Strategy 5: RSI With MACD and VWAP Confluence
| ATGL’s Core RSI Contribution
The highest-probability RSI setups require agreement from at least one additional indicator. RSI alone is a condition; RSI + MACD momentum + VWAP context is a trade. |
The RSI + MACD Combination
RSI provides the momentum reading (overbought/oversold, divergence, pullback zone). MACD histogram provides the momentum direction confirmation. For a long entry: RSI has pulled back to the 40-55 zone (momentum cooling, not reversing) AND the MACD histogram has turned from slightly negative to positive (momentum re-establishing). When both conditions align, the probability of a continuation trade is significantly higher than RSI alone.
The negative scenario: RSI pulls back to 42 (setup condition present) but MACD histogram is still deeply negative and declining. RSI condition says ‘possible entry’; MACD says ‘momentum is still deteriorating.’ Stand aside until MACD confirms.
The VWAP Context Layer
For intraday RSI setups, price position relative to VWAP sets the directional bias. Stock trading above its VWAP with RSI pulling back to the 42-50 zone: the trend is intact, the pullback is moderate — a long setup with tailwind. Same RSI reading when the stock is 2% below its VWAP: the RSI pullback may be part of a larger intraday decline — the long setup faces headwind and requires extra confirmation.
A Complete Confluence Entry Example
All conditions present for a long entry:
- Stock in an intraday uptrend: price above the 9 EMA, above VWAP, session high within the last hour
- RSI on 5-minute chart has pulled back to the 42-50 zone without breaking below 40 (momentum cooling, not reversing)
- MACD histogram has turned from slightly negative to positive on the same candle
- Volume re-enters above the 20-period average on the entry candle
- Stop: below the intraday swing low made during the RSI pullback — a specific price level, not a percentage
All four conditions together produce a high-conviction entry. Any single condition alone is insufficient justification for a trade.
RSI for Day Trading vs Swing Trading: Calibrating the System
Day Trading RSI Calibration
Use 9-period RSI on the 5-minute chart. The most effective intraday RSI setup is the pullback continuation: RSI cools to the 40-55 zone in an established intraday uptrend, then MACD histogram turns positive as the entry trigger. Avoid taking overbought/oversold reversals intraday except in clear range-bound sessions — trending intraday sessions punish counter-trend RSI entries quickly.
Market internals provide the intraday context layer: check TICK and ADD before acting on any RSI setup. A perfect RSI confluence setup in a session with TICK consistently below -400 is fighting institutional headwind. ATGL’s market internals guide covers the specific thresholds.
Swing Trading RSI Calibration
Use 14-period daily RSI. Divergence setups (regular and hidden) are more reliable on daily charts than on intraday charts because each bar represents a full trading day of information and filters out intraday noise. The sector context filter replaces intraday TICK: is the stock’s sector outperforming or underperforming the S&P 500 on the weekly basis? RSI setups in leading sectors (top-performing relative to SPY over 3 months) have higher probability than identical setups in lagging sectors.
The earnings proximity rule applies to all swing trade RSI entries: never enter a new swing position with earnings within 5 trading days unless the event risk is explicitly accounted for in the position size and stop.
The Multi-Timeframe Alignment
The most robust RSI setups align across timeframes: a bullish RSI failure swing on the 5-minute chart in the direction of daily chart RSI above 50 and rising. The shorter timeframe provides the entry trigger; the longer timeframe provides the directional confirmation. Divergence between timeframes (bullish short-term RSI setup in a bearish daily RSI trend) requires extra caution.
RSI as One Reliable Component in a Multi-Factor System
RSI’s value is not in its absolute readings — it is in the specific patterns it creates (divergence, failure swings, trendline breaks, pullbacks to the 40-55 zone) that, when combined with confirmation from MACD, VWAP, and market internals, produce high-probability entry signals.
The five strategies:
- Overbought/oversold with trend context: works in rangebound and pullback scenarios; fails against strong trends; 6-step setup structure with stop below swing low
- Divergence: regular divergence as reversal warning; hidden divergence as continuation confirmation; both require confirmation before entry
- RSI trendlines: draw on the RSI indicator itself; breaks often anticipate price chart breaks by 1-3 candles
- Failure swings: 4-step RSI-only pattern; objective entry trigger; no divergence analysis required
- RSI + MACD + VWAP confluence: the complete entry framework; all three conditions required; the highest-probability RSI subset
| Apply RSI Within ATGL’s Complete Rules-Based System
At AboveTheGreenLine.com we give active traders the complete technical analysis framework — RSI in the context of MACD, VWAP, market internals, and position sizing — not as isolated indicators but as an integrated system with defined entry rules, stop placement, and risk management. Join us Above the Green Line. |
Frequently Asked Questions
Is RSI a good trading strategy?
RSI is a reliable component of a rules-based trading strategy when used with proper context and confirmation — not as a standalone system. The most common RSI mistake is treating overbought (above 70) as an automatic sell and oversold (below 30) as an automatic buy. In trending markets, these levels produce many false signals. RSI works best as one condition within a multi-factor setup that includes trend direction, MACD momentum confirmation, and VWAP context.
What is the best RSI strategy for day trading?
For day trading on 5-minute charts, the most effective RSI strategy is the pullback continuation: in an established intraday uptrend (price above VWAP, TICK positive), use RSI pullbacks to the 40-50 zone as buy opportunities — the RSI is cooling without reversing, providing a lower-risk entry. Use 9-period RSI for faster signals. Confirm with MACD histogram turning positive. Stop below the intraday swing low made during the RSI pullback.
What does RSI 70 mean in trading?
RSI above 70 means the security has experienced strong recent upward momentum and is technically ‘overbought’ by the indicator’s definition. In a rangebound market or after a parabolic move, RSI above 70 often precedes a pullback. In a strong uptrend, RSI can remain above 70 for extended periods — it is confirmation of trend strength, not a reversal signal. RSI above 70 only becomes a genuine sell signal when combined with bearish divergence or a bearish failure swing pattern.
What is RSI divergence?
RSI divergence occurs when the price and RSI indicator move in opposite directions. Bullish divergence: price makes a lower low but RSI makes a higher low — selling momentum is weakening, potentially signalling a reversal upward. Bearish divergence: price makes a higher high but RSI makes a lower high — buying momentum is weakening. Divergence is a warning signal requiring price action confirmation before entry, not an immediate trade trigger. Hidden divergence (reverse: RSI and price converge) is a continuation signal.