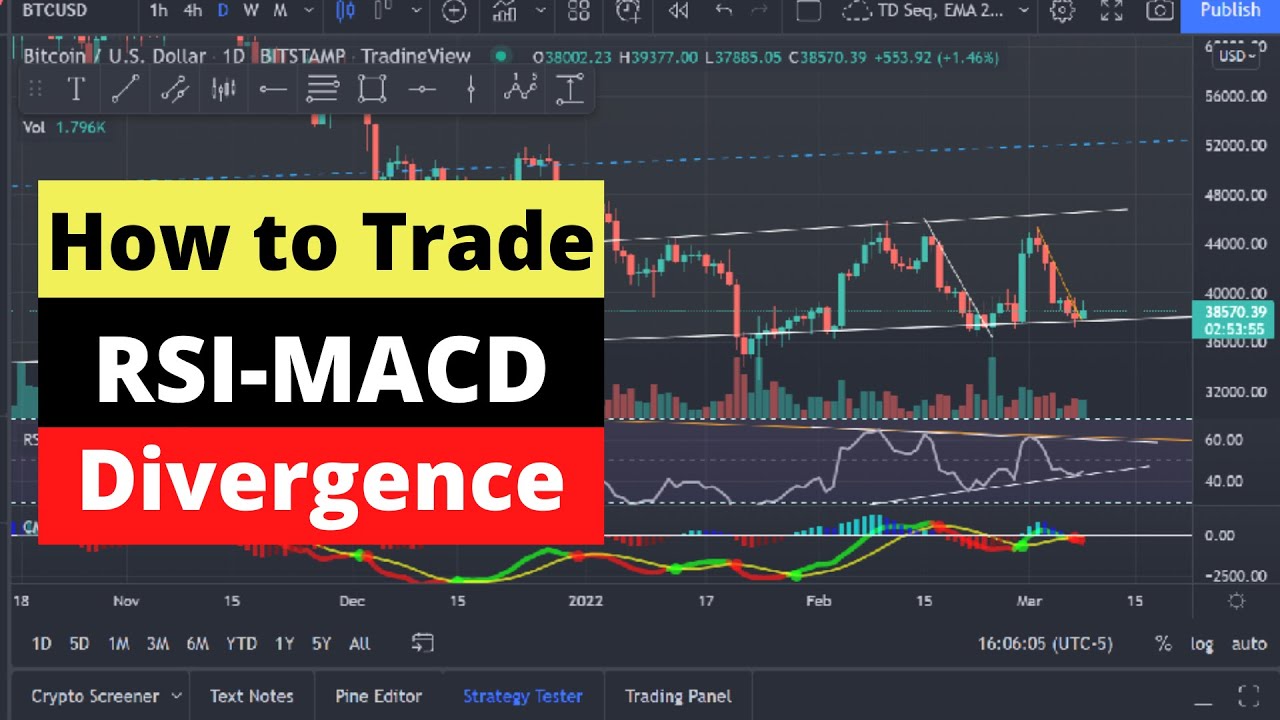
By ATGL
Updated April 20, 2025
Why Divergence Matters in Technical Trading
Spotting trend reversals before they happen is one of the most valuable skills a trader can develop. Divergence trading is one such method—where the behavior of price diverges from an indicator like the Relative Strength Index (RSI) or Moving Average Convergence Divergence (MACD). These divergences can signal a weakening trend and a potential reversal, offering traders the chance to enter positions early or exit before a trend breaks down.
Divergence analysis, when done correctly, enhances decision-making by revealing hidden shifts in momentum that aren’t always visible in price alone. In this guide, you’ll learn how to identify bullish and bearish divergences using RSI and MACD, how to differentiate between regular and hidden signals, and how to incorporate them into your strategy for better entries and exits.
What Is a Divergence?
Divergence occurs when the direction of a technical indicator moves differently from the direction of the price. It reflects a loss of momentum and can often foreshadow a change in trend. There are two primary types:
- Regular Divergence signals a potential reversal of the current trend. For example, price makes a new high, but the indicator makes a lower high—this may indicate weakening bullish momentum.
- Hidden Divergence suggests trend continuation. For instance, if the price makes a higher low but the indicator makes a lower low, it may hint that the bullish trend is still strong.
Both types of divergence can be useful when supported by confirmation from price action or volume. The key is learning how to spot these signals on reliable indicators like RSI and MACD.
Understanding RSI Divergence
The Relative Strength Index (RSI) measures the speed and change of price movements. It oscillates between 0 and 100 and is typically used to identify overbought or oversold conditions. However, RSI divergence is often a more powerful signal than simply reading its value.
- A bullish RSI divergence occurs when price makes a lower low while the RSI forms a higher low. This suggests selling pressure is weakening, even though price is still falling.
- A bearish RSI divergence happens when price makes a higher high, but RSI forms a lower high — indicating the rally may be losing strength.
These divergences work best when they occur near key support/resistance levels or trendlines. For greater accuracy, traders should wait for a confirmation candlestick pattern or a break in market structure before entering a trade.
Understanding MACD Divergence
The MACD is made up of a MACD line, a signal line, and a histogram. It’s designed to show changes in momentum by tracking the convergence and divergence of moving averages. Like RSI, MACD divergence is a reliable way to anticipate reversals.
- A bullish MACD divergence forms when the price makes a lower low, but the MACD line forms a higher low.
- A bearish MACD divergence occurs when the price makes a higher high, but the MACD line makes a lower high.
Unlike RSI, MACD also provides insight through its histogram, which helps visualize the strength and speed of momentum shifts. Watching for divergence along with a MACD crossover or zero-line shift adds even more clarity to your signal.
RSI vs. MACD: Which Is More Reliable?
RSI and MACD each have strengths, and choosing one over the other often depends on the market and timeframe. RSI responds faster to price movements and is ideal for spotting shorter-term divergences. MACD, on the other hand, tends to react more slowly but offers smoother signals and is particularly useful for spotting divergences within larger trends.
Many traders combine both indicators for confirmation. If both RSI and MACD show divergence at the same time, and price is approaching a key support or resistance level, the probability of a successful reversal increases significantly. Using both tools together helps filter out noise and boosts confidence in decision-making.
How to Trade Divergences Effectively
Trading divergence is not just about spotting it—it’s about confirming it and acting with proper risk management. Here’s a structured approach:
- Identify the divergence: Confirm that price and the indicator are moving in opposite directions.
- Look for confirmation: Use candlestick patterns, breakouts, volume spikes, or support/resistance zones to validate the setup.
- Manage the trade: Use stop-losses just below the recent swing low (for bullish divergence) or above the recent swing high (for bearish divergence), and set reasonable take-profit levels based on risk/reward.
Divergence signals should not be used in isolation. They work best when incorporated into a broader strategy that considers trend structure, price action, and market conditions.
Common Pitfalls When Trading Divergences
Divergences can be compelling, but they’re not foolproof. One of the biggest mistakes traders make is acting on divergence signals too early. Just because divergence exists doesn’t mean a reversal is imminent—it only suggests momentum is weakening.
Other common errors include:
- Forcing divergence signals in choppy markets, where false positives are common.
- Ignoring broader market context, such as higher timeframe trends or upcoming news events.
- Failing to confirm with price action, which increases the likelihood of entering weak setups.
Patience, confirmation, and proper risk control are key to making divergence trading work consistently.
Real-World Example: A Divergence Trade in Action
Imagine a scenario where a stock has made a series of lower lows on the price chart, but the RSI is forming higher lows. At the same time, MACD is showing a bullish crossover with a higher low on the histogram. These are early signs that selling pressure is weakening.
The trader waits for the price to break above a recent swing high and confirms with increased volume. A long position is entered, with a stop-loss placed below the most recent low and a take-profit level based on a risk-reward ratio of 2:1. As the price continues to rise, the indicators validate the trend shift, and the trade hits its target.
This example illustrates the power of combining multiple forms of analysis—divergence, price action, and volume—to build high-probability setups.
Final Thoughts: Incorporating Divergence into Your Strategy
Divergence is a powerful concept that, when understood and applied correctly, can become a cornerstone of your trading approach. Whether you use RSI, MACD, or both, the key is to always seek confirmation from price action and trade within the context of the broader trend. At Above the Green Line, we focus on technical clarity, momentum, and strategic setups—divergence analysis fits naturally into this framework.
Traders who master the art of spotting divergences and using them alongside other tools gain an edge in anticipating market turns before the crowd. Practice, backtest, and refine your process—and divergence will quickly become one of your most trusted signals.


[…] and rising, it supports the bullish crossover. Traders often strengthen their analysis by using the RSI MACD divergence strategy to spot early shifts in […]