By ATGL
Updated May 29, 2026
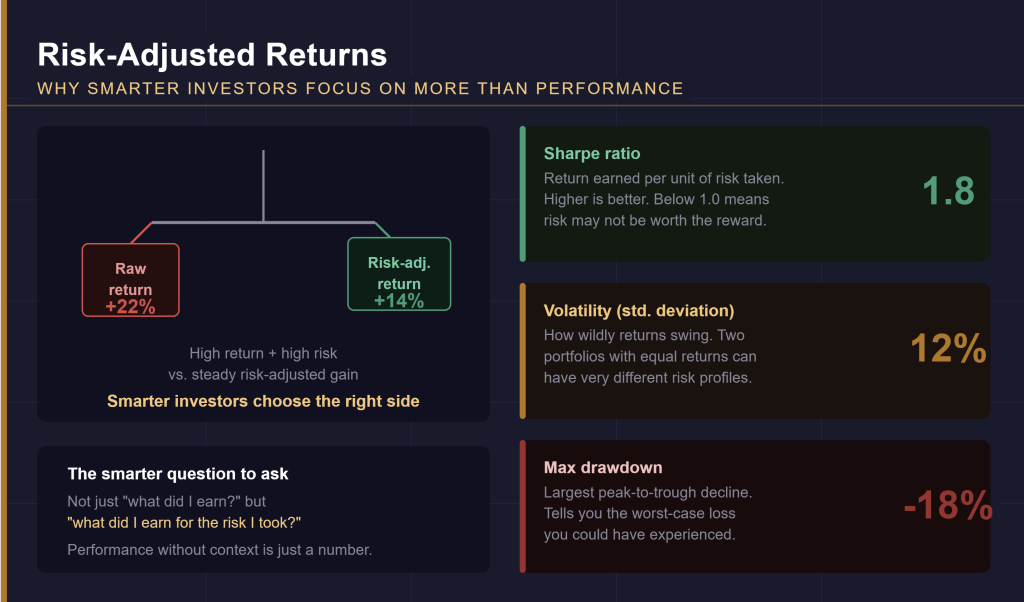
Risk-adjusted returns measure investment performance relative to the amount of risk taken to generate it. While raw return figures are easy to compare, they frequently obscure the full picture of how a portfolio actually behaved over time. Two investors may each report a 15% annual return, yet one may have experienced extreme volatility and deep portfolio declines to reach that figure, while the other maintained steady, controlled growth. That distinction has direct consequences for capital preservation and long-term financial planning, especially when evaluating different investment strategies.
Volatility and downside risk are not abstract concerns — they directly influence compounding, investor behavior, and the long-term viability of a strategy. Systematic investing approaches, which apply predefined rules and quantitative filters to portfolio decisions, address these concerns by reducing emotional interference and keeping risk parameters within defined limits.
Why Risk-Adjusted Returns Matter More Than Raw Performance
Raw performance figures tell only part of the story. Investment efficiency — the return generated per unit of risk — is what separates strategies that appear successful in the short term from those that hold up across a full market cycle.
Consider two portfolios, each returning 12% annually over a five-year period. Portfolio A mirrors a straightforward S&P 500 index strategy during a strong bull market, experiencing multiple drawdowns of 20% or more along the way. Portfolio B uses a rules-based approach that caps drawdowns at 10% and maintains more consistent month-to-month performance. On paper, the returns are identical. In practice, Portfolio A subjects investors to significantly greater psychological and financial strain, increasing the likelihood of emotional decision-making at precisely the wrong moments. Understanding Value at Risk (VaR) adds another layer of context by quantifying the potential downside exposure embedded in any given strategy — context that raw return numbers never provide.
The Most Important Metrics for Measuring Risk-Adjusted Returns
Several established metrics exist to evaluate performance on a risk-adjusted basis:
- Sharpe Ratio: Measures excess return relative to total portfolio volatility.
- Sortino Ratio: Refines the Sharpe ratio by isolating downside volatility, penalizing only harmful risk rather than total price movement.
- Treynor Ratio: Evaluates excess return relative to systematic market risk, using beta as the risk measure rather than standard deviation.
- Jensen’s Alpha: Quantifies portfolio outperformance relative to the expected return predicted by the Capital Asset Pricing Model. Investors familiar with CAPM in finance will recognize this metric as a direct extension of that framework.
Together, these metrics provide a comprehensive framework for assessing whether a strategy is generating returns efficiently or simply taking on disproportionate risk to achieve them.
The Sharpe Ratio and Excess Return Efficiency
The Sharpe ratio, developed by Nobel laureate William Sharpe, is among the most widely applied tools for evaluating risk-adjusted returns. The formula is:
Sharpe Ratio = (Portfolio Return − Risk-Free Rate) ÷ Standard Deviation of Portfolio Returns
In practical terms, it measures how much excess return an investor receives for each unit of total volatility accepted. A higher ratio indicates a more efficient use of risk.
Consider two portfolios: Portfolio X returns 18% annually with a standard deviation of 20%, while Portfolio Y returns 16% annually with a standard deviation of 8%. Assuming a risk-free rate of 4%, Portfolio X carries a Sharpe ratio of 0.70, while Portfolio Y posts a ratio of 1.50. Despite the lower raw return, Portfolio Y delivers meaningfully superior risk-adjusted performance — a distinction that matters considerably for investors managing long-term capital.
The Sortino Ratio and Downside Risk Protection
The Sortino ratio addresses a known limitation in the Sharpe ratio: total standard deviation captures both upward and downward price movements. Upward volatility, while statistically significant, is not damaging to investors. The Sortino ratio corrects for this by measuring only downside deviation — the volatility directly associated with losses.
The formula is:
Sortino Ratio = (Portfolio Return − Risk-Free Rate) ÷ Downside Deviation
This makes the Sortino ratio especially valuable when evaluating capital preservation strategies or comparing funds with asymmetric return profiles. A portfolio may show strong Sharpe performance while still carrying unacceptable drawdown risk; the Sortino ratio surfaces that distinction with greater precision.
Managing Drawdowns to Protect Long-Term Compounding
Maximum drawdown measures the largest peak-to-trough decline in a portfolio’s value over a specified period. It is one of the most direct indicators of downside risk and long-term sustainability.
Large drawdowns damage portfolios in two distinct ways. First, the mathematics of loss recovery are severe: a portfolio that declines 50% must subsequently gain 100% just to return to its previous high-water mark. Second, significant declines tend to trigger emotional responses — panic selling, strategy abandonment, or overcorrection — that compound long-term damage.
Reducing maximum drawdowns, even at the cost of some upside return, supports more stable compounding. A portfolio that avoids a 40% decline in a down year does not simply preserve capital — it preserves the compounding base that generates future gains. Disciplined risk management is not a conservative concession; it is a mathematical advantage across full market cycles.
Using Systematic Strategies to Improve Risk-Adjusted Performance
Systematic investing strategies apply objective, rules-based criteria to portfolio decisions, removing the emotional variability that frequently degrades risk-adjusted metrics over time. Trend-following systems, for example, use technical signals and relative strength rankings to determine which assets to hold and when to exit positions — decisions made according to predefined criteria rather than market sentiment.
Relative strength investing identifies securities outperforming their peer group over a defined lookback period and rotates capital toward the strongest performers. This approach targets favorable return potential while inherently avoiding the weakest, most volatile segments of the market. Predefined stop-loss levels and rebalancing triggers limit drawdown depth and prevent the common error of holding declining positions far longer than sound risk management allows. Backtesting trading strategies against historical data allows investors to evaluate how systematic rules would have performed across various market environments before committing real capital.
Comparing Aggressive Growth Strategies Versus Consistent Risk Management
High-volatility growth strategies can produce strong headline returns during favorable market cycles. When evaluated on a risk-adjusted basis, however, many aggressive approaches reveal significant inefficiencies — substantial drawdowns, poor Sharpe ratios, and performance that depends heavily on sustained bull market conditions.
More consistent, lower-volatility approaches may not generate equivalent peak returns during extended rallies, but they tend to preserve capital during downturns, shorten recovery timelines, and produce stronger risk-adjusted metrics across full cycles. For investors with defined financial objectives, established risk tolerance parameters, or significant capital at stake, consistency is not a compromise — it is a deliberate strategic priority.
The appropriate approach depends on individual circumstances, including time horizon, emotional discipline, and financial goals. What remains constant is the principle that performance must always be evaluated in proportion to the risk required to achieve it.
Leveraging Systematic Models to Optimize Risk-Adjusted Returns
Improving risk-adjusted performance requires more than selecting the right securities — it demands consistent execution, rigorous risk controls, and the analytical tools to monitor performance across the metrics that matter most. Structuring a portfolio around quantitative investment strategies provides the foundation for this kind of disciplined, data-driven decision-making.
Above the Green Line’s membership platform is built to support exactly that. Its proprietary tools and technical charting systems help investors apply systematic rules to their portfolios, track relative strength across sectors, manage drawdown risk in real time, and measure performance using meaningful risk-adjusted metrics rather than surface-level return figures alone. For investors committed to removing emotion from their trading process and building a more disciplined long-term approach, Above the Green Line’s memberships offer a concrete path toward greater consistency and more precise downside risk management.

Related Articles
[pt_view id=”9b64b383ox”]