Above the Green Line -01
  • Market Insights
        • Commentary
          • Daily
          • Weekly
        • BUY / SELL SIGNALS
          • Trade Posts
          • Recent Trade Alerts
          • Recent Day Trades
        • BLOGROLL
          • Dividend Growth Blog
          • ETF Sector Blog
          • Dow Dogs
          • TPOW Blog
  • Strategies
        • SWING TRADING
          • Current Positions
          • Watchlists
          • Closed Positions
          • Candidates - TOP 100
          • Specialty Stocks
        • WEEKLY STOCK PICK
          • TPOW Charts
          • TPOW Performance
          • TPOW Strategy Guide
          • TPOW Performance Dashboard
        • DAY TRADING
          • Watch List
        • ATGL DASHBOARD
        • ETF STRATEGIES
          • ETF Sector Rotation
          • ETF Sector Portfolio
        • DIVIDEND GROWTH
          • Dividend Growth Portfolio
          • Dividend Calendar
        • DOGS OF THE DOW
          • Dogs of the Dow Portfolio
          • DOW 5 Portfolio
  • Markets
        • US MARKET
          • Commodities
          • Energy
          • Precious Metals
          • Volatility
        • GLOBAL MARKETS
          • Market Indices
          • Economic Calendar
          • FOREX Heat Map
          • FOREX Cross Rates
          • Crypto Currency Market
  • Investing
    • Discord Community
    • Dashboard
  • Resources
        • ARTICLES
          • Dividend Growth Model Articles
          • ETF Articles
          • Investment Strategies Articles
          • Market and Economic Insights
          • Stock Trade Articles
          • Stock Reviews
        • TOOLS
          • Stock Scanners
          • Charting Software
          • Brokerage Firms
        • STOCK CHARTS
          • Key Components
          • Reading Charts
          • Drawing Stock Charts
          • Identifying Trends
        • RETIREMENT PLANNING
  • About
    • Contact Us
    • How to Win
    • #1 At Stockcharts
    • Disclaimer
    • FAQ
  • Log In
  • Subscribe

October 26, 2022

Money Wave Alert! Oct 26, 2022

UUP Chart
The US Dollar Fund (UUP) is back down in the Green Zone for a Buy Signal soon.

Markets rallied in the morning, but then weakened as Microsoft & Google were down 7 % & 9 % on Earnings. The Markets are over-bought from a 3400 point DOW 30 Index rally (12%) in 2 weeks, as the Long Term Interest Rates finally dropped. Most of the FEAR has disappeared but there is a good chance that the US Dollar and long Interest Rates will bounce up once more.

Many of the Leaders are quickly back up in the Red Zones (probably too late to Buy for the short term). So maybe some profit taking for a while. The WATCH LIST is small with 2 Inverse Stock Funds in the Green Zones.

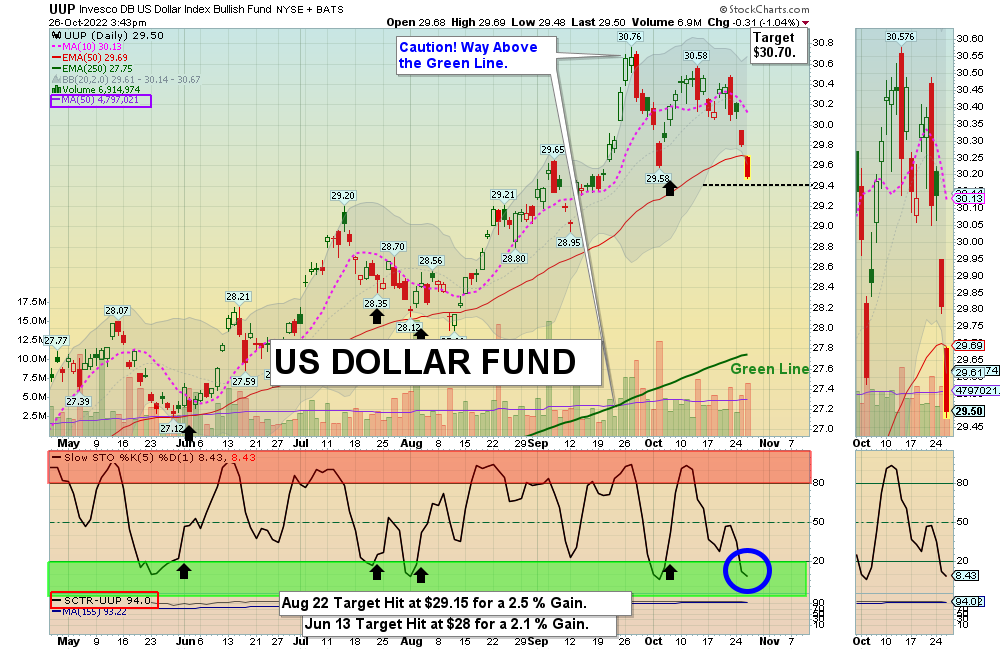
We are waiting for the US Dollar and long Rates to correct back down towards the Green Lines. Thank you for being patient. 

Please be patient and wait for Buy Signals for that are still Above the Green Lines.  BUYS SOON – CHARTS  The best moves are when the S&P 500 Index is also coming up out of the Green Zone. Securities that are still Above the Green Lines now should bounce up well on the next rally.

_________________________________________________________________________________________________________________

BUYS TODAY   10/26/2022        

ENVX      ENOVIX CORP.       Crossed above $18.23 but the Volume was not high. AVOID. 

RVNC      REVANCE THERA.      Money Wave Buy Signal today, but RVNC will not be Bought or Logged as the Volume is below average of 1.7 MIL.

We will “Not Log” trades if the Reward/Risk is not at least 2:1, or Low Volume. These have more risk.     

BUYS TOMORROW     

PSQ      INVERSE NASDAQ 100 FUND       Wait for Money Wave Close > 20 with High Volume.   

SH      INVERSE S&P 500 FUND       Wait for Money Wave Close > 20 with High Volume.     

Shop for a better price earlier in the day with Triple Buy Signal, on the same day that a Daily Money Wave Buy Signal will occur.  

BUYS SOON          

PBR      PETROBRAS ENERGY      Wait for Money Wave Close > 20 with High Volume.      

UUP      US DOLLAR FUND      Wait for Money Wave Close > 20 with High Volume.

Please be patient and Wait for Money Wave Buy Signals.  We will email you when they are ready. Follow on the WATCH LIST.   

SELLS TODAY            

DHT       DHT HOLDINGS INC.      Target Hit at $9 for a 21.8 % Gain. This trade was not logged.

FSLR      FIRST SOLAR      Slipped below the Buy Price of $131.32 and Stopped Out even. (Don’t Take a Loss!)      

____________________________________________________________________________________________________

DAY TRADING SETUPS.  Several Triple Buy Pops today: BNGO (+9%) LABU (+9%) VERU (+9%) MARA (+8%) & SQQQ (+7%). ( Try out the New Side by Side layout.      

DAY TRADING FOR INDICES & LARGE CAPS CHARTS.

Bonds were up today but are Way Below the Green Line.  

Crude Oil was up $2.78 today at $88.10.

MY TRADING DASHBOARD 
SWING TRADING CURRENT POSITIONS
DAY TRADING SETUPS
TRADE ALERTS
GREEN LINE CHARTS AT STOCKCHARTS
ARE YOUR INVESTMENTS ABOVE THE GREEN LINE?
GREEN LINE RULES
ETF SECTOR ROTATION SYSTEM   
New TOP 100 LIST Updated Oct 1, 2022

Many like to Buy the Swing Trades just before the Close, if the Money Wave is going to create a Buy Signal (Closing > 20 and up out of the Green Zone). Don’t Buy if the Security has already popped up too much. Money Wave Buy Signals are usually good for a 3-6 % move in a few days.

We will “Not Log” trades if the Reward/Risk is not at least 2:1, or Low Volume. These have more risk.     

Related Post

– ENVX

Subscribe to Our Newsletter

AGL Logo

Get our eBook Now!

Candlestick - A Swing Traders Friend

We don’t spam! Read our privacy policy for more info.

You’ve been successfully subscribed to our newsletter!

Voted #1 at Stock Charts

SH Chart
Inverse S&P 500 Fund (SH) will have a Money Wave Buy today.

Help Us Help Animals

Help Us Help Animals

Recent Comments

  • Market Breadth Indicators: A Trader’s Guide to Early Trend Detection on Backtesting: Definition and How a Trading Strategy Backtest Works
  • Island Reversal Pattern: Definition and Formation Explained on Double Top Pattern: How to Identify and Trade This Reversal Signal
  • Channel Pattern Guide: What It Is and Why It Matters on A Guide to Forecasting Using Moving Averages
  • What Is a Broadening Bottom Chart Pattern? Full Guide on Bull vs. Bear Market: An Investor’s Guide to Market Phases
  • ATGL Weekly Money Flow - 2025-05-11 on ATGL Top Pick of the Week! Apr 6, 2025

Become a Green Liner!

Help me make more Money in the Stock Market.

ON ATGL

  • DashBoard
  • Weekly Commentary
  • Daily Buy / Sell Signals
  • Day Trade Setup
  • Trading Rooms

Design & Develop By Pixelvect

STRATEGIES

  • Swing Trading
  • ATGL Pick of the Week
  • Dividend Growth
  • ETF Sector Rotation
  • Dogs of the Dow

HELP

  • ATGL Trading Rules
  • FAQ
  • Account Maintenance
  • Contact US
  • Join

FOLLOW US

Instagram Linkedin Twitter Facebook

© COPYRIGHT 2024 · ABOVETHEGREENLINE.COM · ALL RIGHTS RESERVED · PRIVACY · TERMS · CONTACT · WATCHLIST · CURRENT