Watch List and Charts to Buy Soon.
| Daily Swing Watch List to Buy | Daily Swing Charts to Buy |
| Current Daily Swing Positions | Current Swing Charts |
| Closed Daily Swing Results | Trading Dashboard |
Current Pick and Chart
| Top Pick of the Week | TPOW Stock Chart |
Nov 5, 2025 Today the markets opened higher as the SPY attempted a potential retest of recent highs, with no M pattern yet to confirm a mean reversion. GDX miners performed well, bouncing back strongly while the overall market remained in a minor corrective phase.
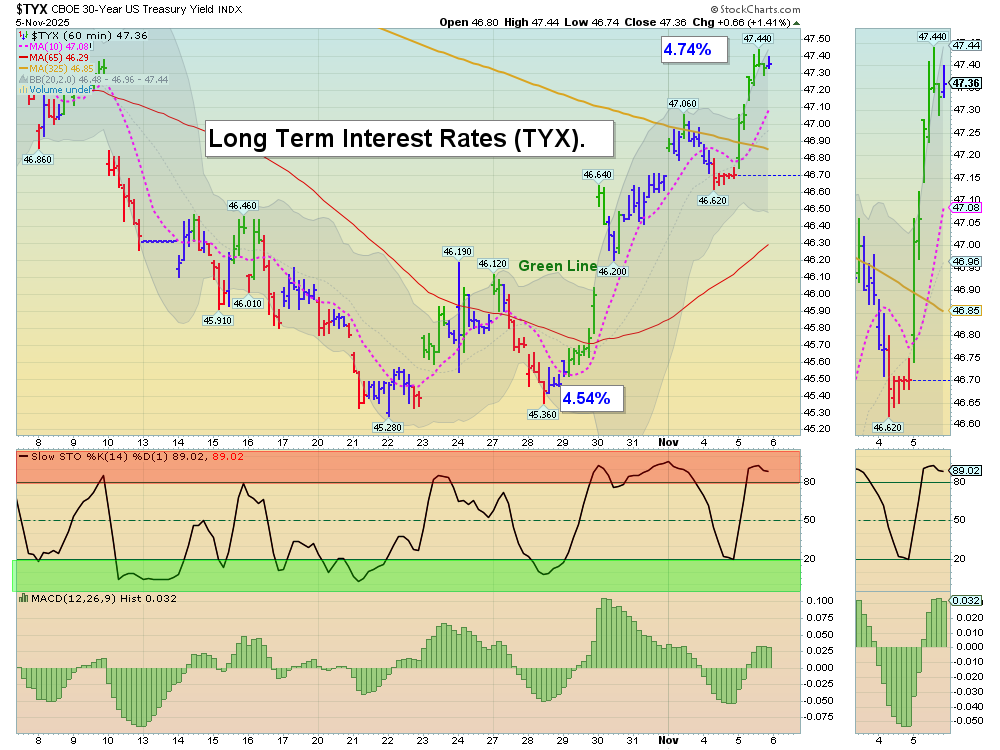
TLT bonds continued to weaken sharply, falling like a knife toward their fair value near the Bananas Line. Despite today’s softer tone, we expect large caps like QQQ and SPY to retrace back up and possibly form an M pattern soon.
Wait for more Buy Signals coming up out of the Green Zones. WATCH LIST CHARTS
The best moves happen when the S&P 500 Index is also coming up out of the Green Zone.
______________________________________________________________________________
BUYS TODAY 11/05/2025 NONE TODAY
BUYS SOON
| Open Date | Symbol | Description | SCTR | Last Price | Daily Change % | Comments | ATGL 60 Min | id | Strategy | Position | Sell Date | Sell Price | Purchase Price | Net Profit | Realized Gain/Loss % | ATGL Rule | Industry | Size | Stop Loss | color | Chart | Update Date | Status | Unrealized Gain/Loss % | Volume | Post Type | # Shares | Amount Invested | Portfolio Weight | Dividend Rate | Current Yield | Current Value | Yield on Cost | Projected Annual Dividends | Total Dividends Received | Pay Back | Profit / Loss | Annualized Profit/Loss | Star Rating | Target Price | News Alert % | Target Triggered |
|---|---|---|---|---|---|---|---|---|---|---|---|---|---|---|---|---|---|---|---|---|---|---|---|---|---|---|---|---|---|---|---|---|---|---|---|---|---|---|---|---|---|---|
| 2026-07-10 | CLOV | Clover Health | 94 | $4.44 | -5.1282 | Wait for next Daily Money Wave Close > 20 with High Volume. | 5124 | Short Term | Long | $0.00 | 0.00% | HealthCare | Small | https://stockcharts.com/sc3/ui/?s=CLOV&a=1766885665&p=D&yr=0&mn=4&dy=0&id=p31687006556 | 2026-07-10 15:45:37 | open | 0.00% | 6010321 | Watch List | $0 | 0.00% | 0.00 | 0 | $0 | 0.00% | $0 | $0 | 0.00% | 0.00% | - | $5.30 | |||||||||||
| 2026-07-10 | MRNA | Moderna Inc. | 98 | $68.27 | -10.8281 | Money Wave Must Close in the Green Zone. | 5125 | Short Term | Long | $0.00 | 0.00% | HealthCare | Mid | https://stockcharts.com/sc3/ui/?s=MRNA&a=2173993901&p=D&yr=0&mn=4&dy=0&id=p88520548034 | 2026-07-10 16:03:06 | open | 0.00% | 9202370 | Watch List | $0 | 0.00% | 0.00 | 0 | $0 | 0.00% | $0 | $0 | 0.00% | 0.00% | - | $78.00 | |||||||||||
| 2026-07-10 | FCEL | FuelCell Energy | 98 | $21.03 | -8.5652 | Wait for next Daily Money Wave Close > 20 with High Volume. | 5126 | Short Term | Long | $0.00 | 0.00% | Energy | Small | https://stockcharts.com/sc3/ui/?s=FCEL&a=2283130700&p=D&yr=0&mn=4&dy=0&id=p42915098372 | 2026-07-10 16:24:39 | open | 0.00% | 12394004 | Watch List | $0 | 0.00% | 0.00 | 0 | $0 | 0.00% | $0 | $0 | 0.00% | 0.00% | - | $28.00 |
Shop for a better price earlier in the day with Green Candle Buy Signal, on the same day that a Daily Money Wave Buy Signal will occur.
Many like to Buy the Swing Trades just before the Close, if the Money Wave is going to create a Buy Signal (Closing > 20 and up out of the Green Zone). Don’t Buy if the Security has already popped up too much. Money Wave Buy Signals are usually good for a 3-6 % move in a few days.
DAILY SWING SELLS TODAY NONE TODAY
________________________________________________________________________
WEEKLY SWING TRADE POPS NONE TODAY
WEEKLY SWING TRADING (Formerly LONG TERM)Watch List and Charts to Buy Soon.
| Weekly Swing Watch List to Buy | Weekly Swing Charts to Buy |
| Current Weekly Positions | Current Weekly Charts |
| Closed Weekly Swing Trades | Stage Chart Investing |
DAY TRADING SETUPS. Today we had 23 scalp trades for nice Gains at our Trading Room. In this Emotional Market now, Day Trading Alerts are not being sent out on our Discord Site with Live Chatting. Please install Discord app on your PC or cell for mobile notifications. Check out our Live Stream.
Or look for Green Candle Buy Pops (Red Candle turns Green). Big Movers today: IREN +13% ETHU +15% & SOXL +13%
Bonds were down today and are Above the Green Line.
Crude Oil was down $0.94 today at $59.61.
MY TRADING DASHBOARD
SWING TRADING CURRENT POSITIONS
DAY TRADING SETUPS
TRADE ALERTS
STAGE CHART INVESTING
TOP 100 STOCKS
PREVIOUS GREEN LINE STOCKS