Watch List and Charts to Buy Soon.
| Daily Swing Watch List to Buy | Daily Swing Charts to Buy |
| Current Daily Swing Positions | Current Swing Charts |
| Closed Daily Swing Results | Trading Dashboard |
Current Pick and Chart
| Top Pick of the Week | TPOW Stock Chart |
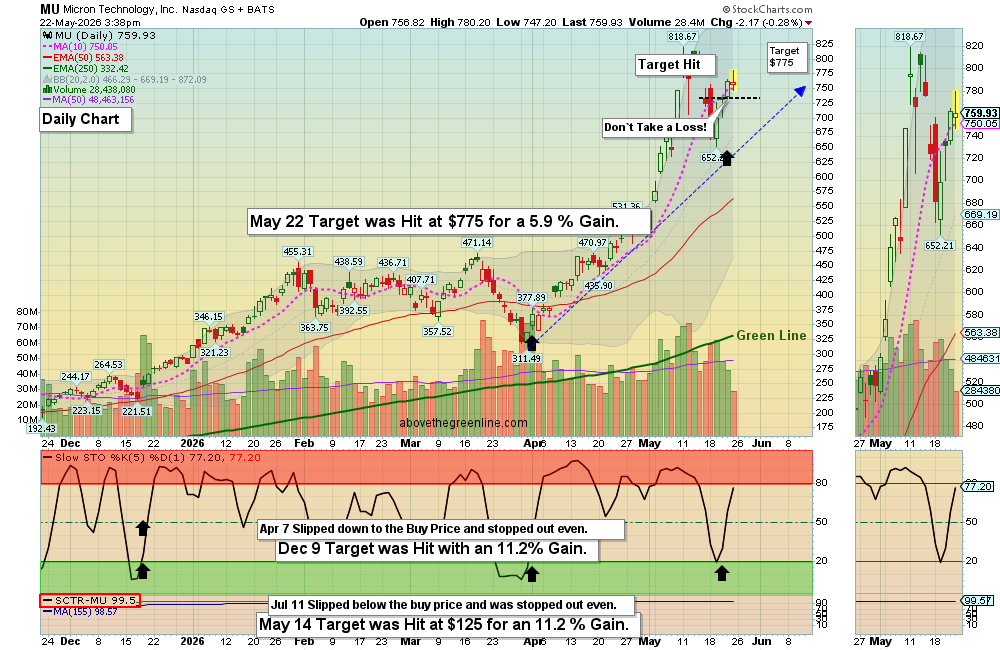
May 6, 2026 Today the Markets Gapped Up again, with large caps like SPY gapping up and steadily moving higher through the session. More Panic Buying on FOMO & GREED. The Mag 7 Tech ETF also printed fresh highs, though on relatively low volume, suggesting limited conviction.
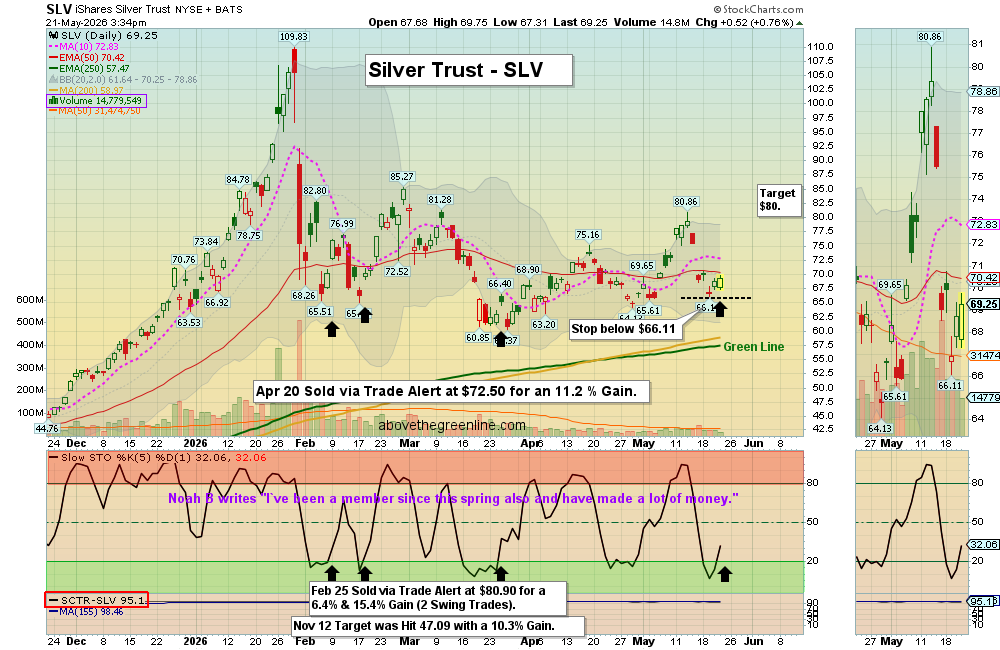
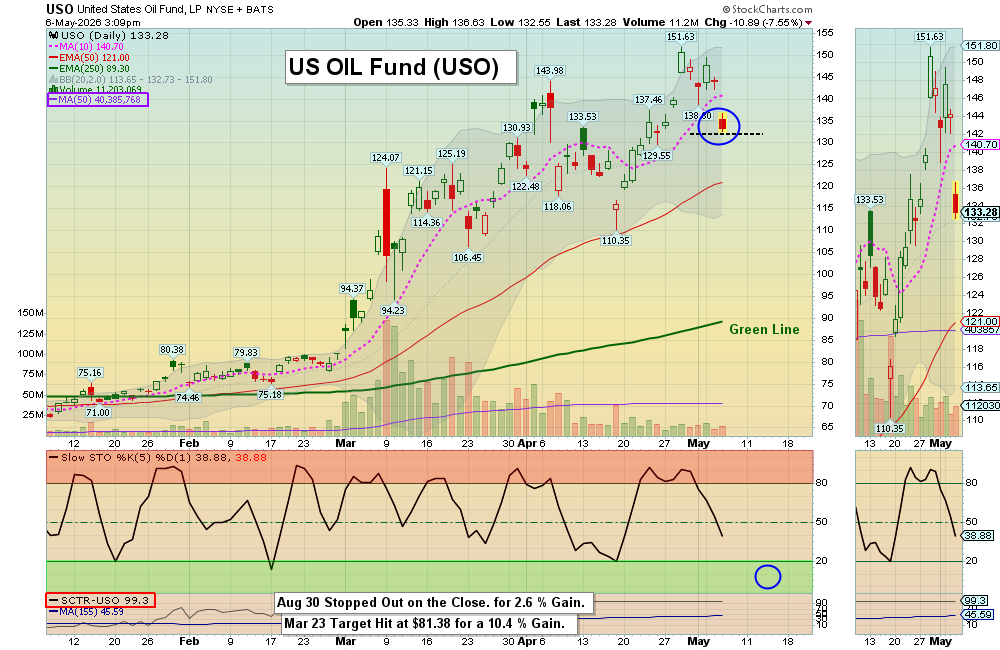
Gold and silver moved higher on gap-ups, while Oil Fund ($USO) declined, reflecting the typical inverse behavior between commodities and Oil. The day ended with a swing buy taken in $XPO, though it is already close to its target.
Wait for more Buy Signals coming up out of the Green Zones. WATCH LIST CHARTS
The best moves happen when the S&P 500 Index is also coming up out of the Green Zone.
______________________________________________________________________________
BUYS TODAY 05/06/2026
XPO Xpo Logistics Inc. Swing Trade Buy Signal, but the Volume is low. AVOID.
BUYS SOON
| Open Date | Symbol | Description | SCTR | Last Price | Daily Change % | Comments | ATGL 60 Min | id | Strategy | Position | Sell Date | Sell Price | Purchase Price | Net Profit | Realized Gain/Loss % | ATGL Rule | Industry | Size | Stop Loss | color | Chart | Update Date | Status | Unrealized Gain/Loss % | Volume | Post Type | # Shares | Amount Invested | Portfolio Weight | Dividend Rate | Current Yield | Current Value | Yield on Cost | Projected Annual Dividends | Total Dividends Received | Pay Back | Profit / Loss | Annualized Profit/Loss | Star Rating | Target Price | News Alert % | Target Triggered |
|---|---|---|---|---|---|---|---|---|---|---|---|---|---|---|---|---|---|---|---|---|---|---|---|---|---|---|---|---|---|---|---|---|---|---|---|---|---|---|---|---|---|---|
| 2026-07-10 | CLOV | Clover Health | 94 | $4.44 | -5.1282 | Wait for next Daily Money Wave Close > 20 with High Volume. | 5124 | Short Term | Long | $0.00 | 0.00% | HealthCare | Small | https://stockcharts.com/sc3/ui/?s=CLOV&a=1766885665&p=D&yr=0&mn=4&dy=0&id=p31687006556 | 2026-07-10 15:45:37 | open | 0.00% | 6010321 | Watch List | $0 | 0.00% | 0.00 | 0 | $0 | 0.00% | $0 | $0 | 0.00% | 0.00% | - | $5.30 | |||||||||||
| 2026-07-10 | MRNA | Moderna Inc. | 98 | $68.27 | -10.8281 | Money Wave Must Close in the Green Zone. | 5125 | Short Term | Long | $0.00 | 0.00% | HealthCare | Mid | https://stockcharts.com/sc3/ui/?s=MRNA&a=2173993901&p=D&yr=0&mn=4&dy=0&id=p88520548034 | 2026-07-10 16:03:06 | open | 0.00% | 9202370 | Watch List | $0 | 0.00% | 0.00 | 0 | $0 | 0.00% | $0 | $0 | 0.00% | 0.00% | - | $78.00 | |||||||||||
| 2026-07-10 | FCEL | FuelCell Energy | 98 | $21.03 | -8.5652 | Wait for next Daily Money Wave Close > 20 with High Volume. | 5126 | Short Term | Long | $0.00 | 0.00% | Energy | Small | https://stockcharts.com/sc3/ui/?s=FCEL&a=2283130700&p=D&yr=0&mn=4&dy=0&id=p42915098372 | 2026-07-10 16:24:39 | open | 0.00% | 12394004 | Watch List | $0 | 0.00% | 0.00 | 0 | $0 | 0.00% | $0 | $0 | 0.00% | 0.00% | - | $28.00 |
Shop for a better price earlier in the day with Green Candle Buy Signal, on the same day that a Daily Money Wave Buy Signal will occur.
Many like to Buy the Swing Trades just before the Close, if the Money Wave is going to create a Buy Signal (Closing > 20 and up out of the Green Zone). Don’t Buy if the Security has already popped up too much. Money Wave Buy Signals are usually good for a 3-6 % move in a few days.
DAILY SWING SELLS TODAY NONE TODAY
________________________________________________________________________
WEEKLY SWING TRADE POPS NONE TODAY
WEEKLY SWING TRADING (Formerly LONG TERM)Watch List and Charts to Buy Soon.
| Weekly Swing Watch List to Buy | Weekly Swing Charts to Buy |
| Current Weekly Positions | Current Weekly Charts |
| Closed Weekly Swing Trades | Stage Chart Investing |
DAY TRADING SETUPS. Today we had 14 scalp trades for nice Gains at our Trading Room. In this Emotional Market now, Day Trading Alerts are not being sent out on our Discord Site with Live Chatting. Please install Discord app on your PC or cell for mobile notifications. Check out our Live Stream.
Or look for Green Candle Buy Pops (Red Candle turns Green). Big Movers today: AMD +18% GDXU +22% & GLW +13%.
Bonds were up today and are Below the Green Line.
Crude Oil was down $7.41 today at $102.63.
TOP PICK OF THE WEEK
MY TRADING DASHBOARD
SWING TRADING CURRENT POSITIONS
DAY TRADING SETUPS
TRADE ALERTS
STAGE CHART INVESTING
TOP 100 STOCKS
PREVIOUS GREEN LINE STOCKS