Above the Green Line -01
  • Market Insights
        • Commentary
          • Daily
          • Weekly
        • BUY / SELL SIGNALS
          • Trade Posts
          • Recent Trade Alerts
          • Recent Day Trades
        • BLOGROLL
          • Dividend Growth Blog
          • ETF Sector Blog
          • Dow Dogs
          • TPOW Blog
  • Strategies
        • SWING TRADING
          • Current Positions
          • Watchlists
          • Closed Positions
          • Candidates - TOP 100
          • Specialty Stocks
        • WEEKLY STOCK PICK
          • TPOW Charts
          • TPOW Performance
          • TPOW Strategy Guide
          • TPOW Performance Dashboard
        • DAY TRADING
          • Watch List
        • ATGL DASHBOARD
        • ETF STRATEGIES
          • ETF Sector Rotation
          • ETF Sector Portfolio
        • DIVIDEND GROWTH
          • Dividend Growth Portfolio
          • Dividend Calendar
        • DOGS OF THE DOW
          • Dogs of the Dow Portfolio
          • DOW 5 Portfolio
  • Markets
        • US MARKET
          • Commodities
          • Energy
          • Precious Metals
          • Volatility
        • GLOBAL MARKETS
          • Market Indices
          • Economic Calendar
          • FOREX Heat Map
          • FOREX Cross Rates
          • Crypto Currency Market
  • Investing
    • Discord Community
    • Dashboard
  • Resources
        • ARTICLES
          • Dividend Growth Model Articles
          • ETF Articles
          • Investment Strategies Articles
          • Market and Economic Insights
          • Stock Trade Articles
          • Stock Reviews
        • TOOLS
          • Stock Scanners
          • Charting Software
          • Brokerage Firms
        • STOCK CHARTS
          • Key Components
          • Reading Charts
          • Drawing Stock Charts
          • Identifying Trends
        • RETIREMENT PLANNING
  • About
    • Contact Us
    • How to Win
    • #1 At Stockcharts
    • Disclaimer
    • FAQ
  • Log In
  • Subscribe

January 12, 2024

Money Wave Alert! Jan 12, 2024

SVXY chart
The Greed Index (SVXY) is looking tired (over-bought).
SWING TRADING (SHORT TERM)
Watchlist and Charts
Watch ListWatch List Charts
Current PositionsCurrent Charts
Closed ResultsTrading Dashboard

MARKETS WILL BE CLOSED ON MONDAY FOR A FEDERAL HOLIDAY (MLK).

1/12/2024 Markets were mixed again today on slower trading. The BitCoin Stocks have been wild for the last 2 days, as the SEC approved some ETFs which left some of the strong BitCoin stocks to drop on FEAR (where we like to Buy soon).

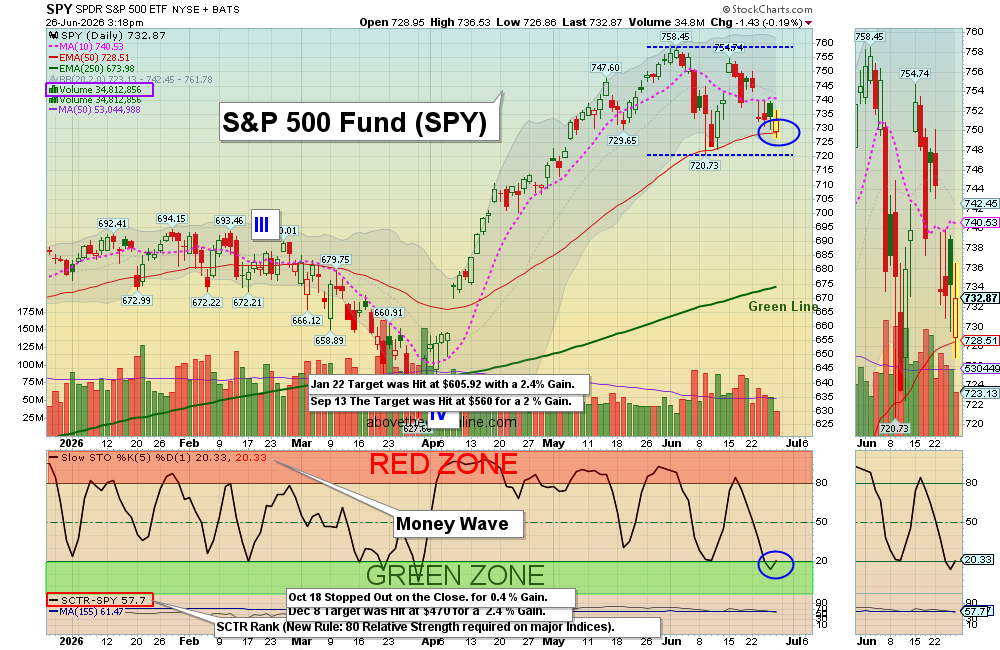
Now the Leaders & Indices must make higher highs soon for the rally to continue.

Wait for more Buy Signals soon, coming up out of the Green Zones.  CHARTS  The best moves happen when the S&P 500 Index is also coming up out of the Green Zone. 

______________________________________________________________________________

BUYS TODAY   1/12/2024      NONE TODAY       

BUYS TOMORROW               

IBRX      IMMUNITYBIO INC.      Wait for Daily Money Wave Close > 20 with High Volume. 

MSTR      MICROSTRATEGY INC.     Relative Strength has dropped Below 90. Avoid.

Shop for a better price earlier in the day with Triple Buy Signal, on the same day that a Daily Money Wave Buy Signal will occur.  

BUYS SOON                       

MARA      MARA DIGITAL      Money Wave Must Close in the Green Zone.

TAL      TAL EDUCATION GROUP      Money Wave Must Close in the Green Zone.     

TBT      INVERSE T-BOND FUND (2X)       Below the Green Line. AVOID for now. Buy above $34.56.   

Please be patient and Wait for Money Wave Buy Signals.  We will email you when they are ready. Follow on the WATCH LIST.   

Many like to Buy the Swing Trades just before the Close, if the Money Wave is going to create a Buy Signal (Closing > 20 and up out of the Green Zone). Don’t Buy if the Security has already popped up too much. Money Wave Buy Signals are usually good for a 3-6 % move in a few days.

SELLS TODAY            

ARKK      ARKK INNOVATION FUND      EXIT if it is going to Close below Support of $48.07. This trade was not logged.     

COIN      COINBASE GLOBAL      Lower Sell Stop Loss below the Red Line below $125.00 until it bottoms. The Money Wave is back down in the Green Zone.

CVNA      CARVANA CO.      EXIT if it is going to Close below Support of $44.50. This trade was not logged.     

MARA      MARA DIGITAL      The Target was actually Hit yesterday at $28 during the SEC News confusion. If you did not get out, LOWER the Sell Stop Loss below the Red Line around $18.46, for another bounce. This trade was not logged.

________________________________________________________________________

DAY TRADING SETUPS.  Today 2 trades for -$110.00. Day Trading Alerts are now being sent out on our new Discord Site with Live Chatting. Please install Discord app on your pc or cell for mobile notifications. Also follow our Trading Room for quick trades. Or look for Triple Buy Pops (3 Green Circles). Big Movers today:  UNG (+8%) URA (+6%) & TSLQ (+4%). Try out the Side by Side layout.      

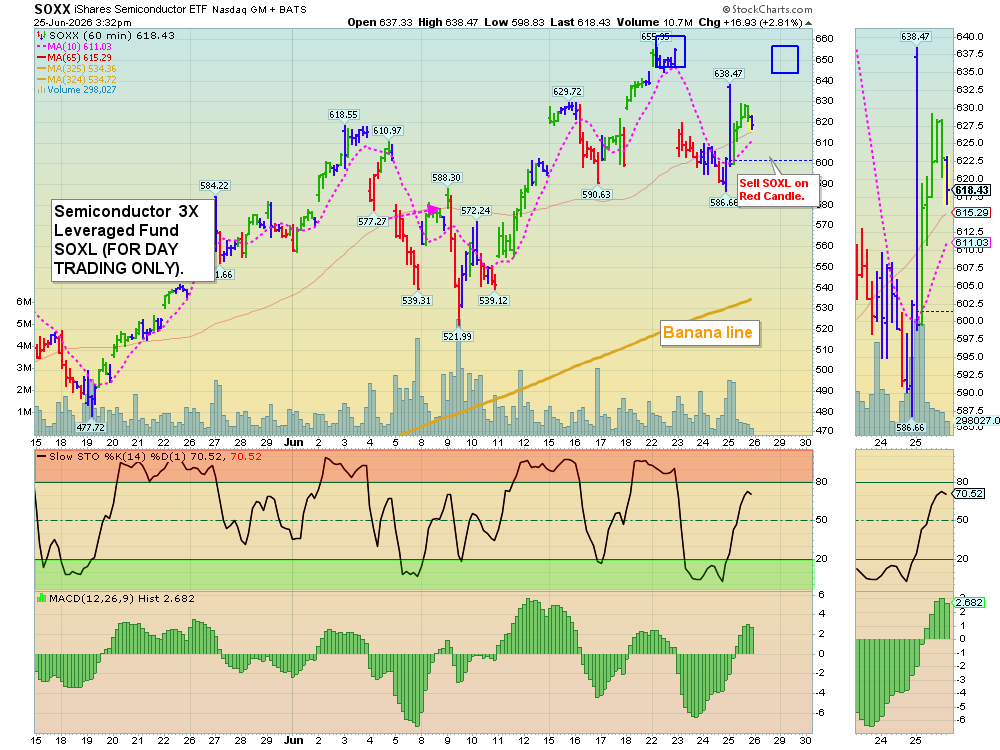
DAY TRADING FOR INDICES & LARGE CAPS CHARTS.

Bonds were up today and are Above the Green Line.  

Crude Oil was up $0.79 today at $72.81.

MY TRADING DASHBOARD 
SWING TRADING CURRENT POSITIONS
DAY TRADING SETUPS
TRADE ALERTS
GREEN LINE CHARTS AT STOCKCHARTS
ARE YOUR INVESTMENTS ABOVE THE GREEN LINE?
GREEN LINE RULES
ETF SECTOR ROTATION SYSTEM   
New TOP 100 LIST Updated Jan 2, 2024

 * Safer Trades that meet ALL three criteria will be classified as 3 STAR, while trades that only meet two of the three criteria will be flagged as 2 STAR (more risk).   

HAVE A NICE HOLIDAY WEEKEND!

Related Post

– CVNA
– Money Wave Alert! Jan 11, 2024

Subscribe to Our Newsletter

AGL Logo

Get our eBook Now!

Candlestick - A Swing Traders Friend

We don’t spam! Read our privacy policy for more info.

You’ve been successfully subscribed to our newsletter!

Voted #1 at Stock Charts

SH Chart
Inverse S&P 500 Fund (SH) will have a Money Wave Buy today.

Help Us Help Animals

Help Us Help Animals

Recent Comments

  • Market Breadth Indicators: A Trader’s Guide to Early Trend Detection on Backtesting: Definition and How a Trading Strategy Backtest Works
  • Island Reversal Pattern: Definition and Formation Explained on Double Top Pattern: How to Identify and Trade This Reversal Signal
  • Channel Pattern Guide: What It Is and Why It Matters on A Guide to Forecasting Using Moving Averages
  • What Is a Broadening Bottom Chart Pattern? Full Guide on Bull vs. Bear Market: An Investor’s Guide to Market Phases
  • ATGL Weekly Money Flow - 2025-05-11 on ATGL Top Pick of the Week! Apr 6, 2025

Become a Green Liner!

Help me make more Money in the Stock Market.

ON ATGL

  • DashBoard
  • Weekly Commentary
  • Daily Buy / Sell Signals
  • Day Trade Setup
  • Trading Rooms

Design & Develop By Pixelvect

STRATEGIES

  • Swing Trading
  • ATGL Pick of the Week
  • Dividend Growth
  • ETF Sector Rotation
  • Dogs of the Dow

HELP

  • ATGL Trading Rules
  • FAQ
  • Account Maintenance
  • Contact US
  • Join

FOLLOW US

Instagram Linkedin Twitter Facebook

© COPYRIGHT 2024 · ABOVETHEGREENLINE.COM · ALL RIGHTS RESERVED · PRIVACY · TERMS · CONTACT · WATCHLIST · CURRENT