Watch List and Charts to Buy Soon.
| Daily Swing Watch List to Buy | Daily Swing Charts to Buy |
| Current Daily Swing Positions | Current Swing Charts |
| Closed Daily Swing Results | Trading Dashboard |
Current Pick and Chart
| Top Pick of the Week | TPOW Stock Chart |
Top Pick of the Week: Figs Inc. $FIGS was kept from the previous week and will be Sold on the Close Friday.
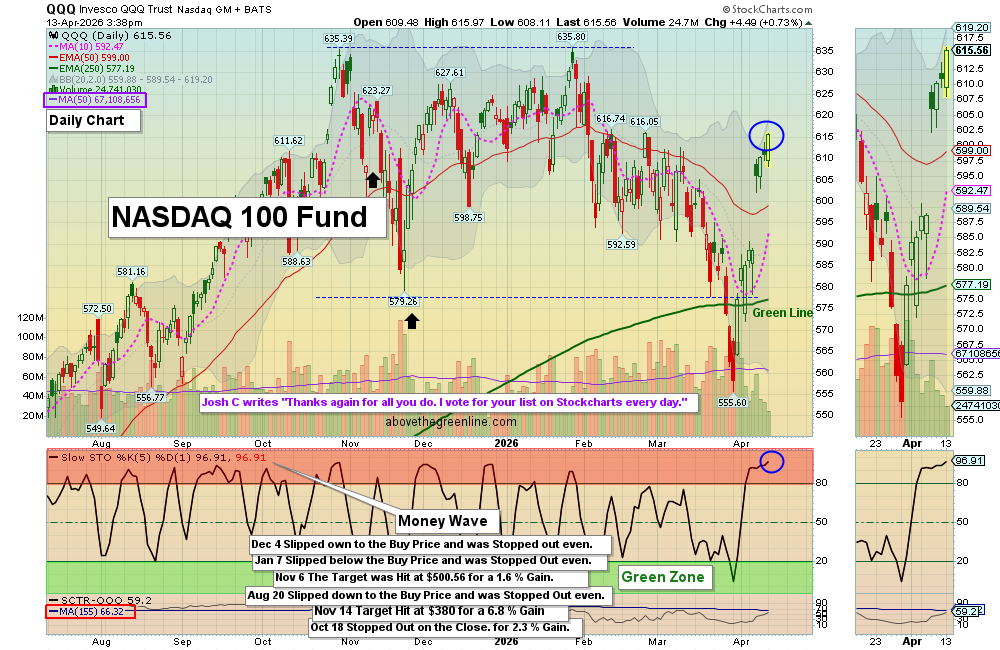
Apr 13, 2026 Today, Markets opened on a stronger note, with large caps like SPY gradually moving higher and trading above the bananas line, though the move lacked strong conviction. There remains a possibility of another downside leg, as the inverse fund SH is below the Bananas Line and SPY could form a short term double top M pattern with another upside wave.
The greed index SVXY also met the bananas line on the 1-hour chart, indicating normalized sentiment as fear fades. Overall, the week started with mixed conditions, with U.S. Oil showing strong upside on a gap up, and the day ended on a positive note with no swing buys taken.
Wait for more Buy Signals coming up out of the Green Zones. WATCH LIST CHARTS
The best moves happen when the S&P 500 Index is also coming up out of the Green Zone.
______________________________________________________________________________
BUYS TODAY 04/13/2026 NONE TODAY
BUYS SOON
Watchlist is for Members Only
There are currently <strong>2</strong> investments on deck to be purchased, based on our Daily Swing Trading strategy.
| ✅ Every stock currently on deck | ✅ Real-time SCTR and price data |
| ✅ Daily % change tracking | ✅ Entry criteria and comments for each pick |
|
Already a Member? 🔒 LOG IN → |
Not a Member Yet? VIEW MEMBERSHIP PLANS → |
Current Watchlist (Preview)
Become a member to see exactly which stocks are on deck and why.
| Open Date | Symbol | Description | SCTR | Last Price | Daily Change % | Comments |
|---|---|---|---|---|---|---|
| 🔒 | 🔒 | 🔒 | 🔒 | 🔒 | 🔒 | Members Only |
| 🔒 | 🔒 | 🔒 | 🔒 | 🔒 | 🔒 | Members Only |
| 🔒 | 🔒 | 🔒 | 🔒 | 🔒 | 🔒 | Members Only |
⭐ Join today to see our full watchlist and get alerted the moment we buy.
BECOME A MEMBER →Past performance is not indicative of future results.
Shop for a better price earlier in the day with Green Candle Buy Signal, on the same day that a Daily Money Wave Buy Signal will occur.
Many like to Buy the Swing Trades just before the Close, if the Money Wave is going to create a Buy Signal (Closing > 20 and up out of the Green Zone). Don’t Buy if the Security has already popped up too much. Money Wave Buy Signals are usually good for a 3-6 % move in a few days.
DAILY SWING SELLS TODAY NONE TODAY
________________________________________________________________________
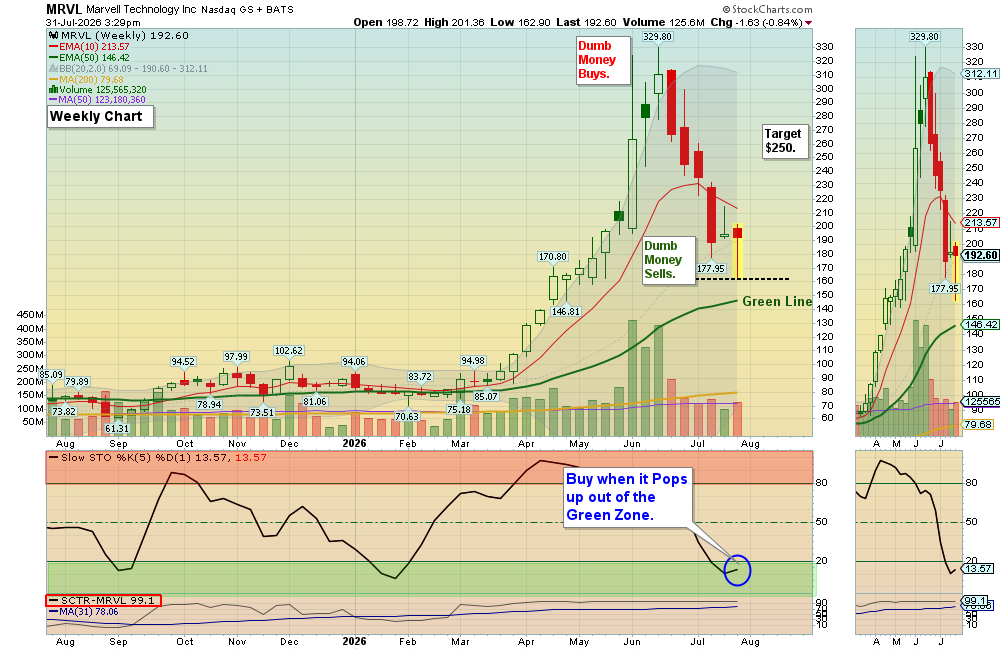
WEEKLY SWING TRADE POPS NONE TODAY
WEEKLY SWING TRADING (Formerly LONG TERM)Watch List and Charts to Buy Soon.
| Weekly Swing Watch List to Buy | Weekly Swing Charts to Buy |
| Current Weekly Positions | Current Weekly Charts |
| Closed Weekly Swing Trades | Stage Chart Investing |
DAY TRADING SETUPS. Today we had 22 scalp trades for nice Gains at our Trading Room. In this Emotional Market now, Day Trading Alerts are not being sent out on our Discord Site with Live Chatting. Please install Discord app on your PC or cell for mobile notifications. Check out our Live Stream.
Or look for Green Candle Buy Pops (Red Candle turns Green). Big Movers today: BATL +25% TE +10% & SNDK +11%.
Bonds were up today and are Above the Green Line.
Crude Oil was up $1.42 today at $97.93.
TOP PICK OF THE WEEK
MY TRADING DASHBOARD
SWING TRADING CURRENT POSITIONS
DAY TRADING SETUPS
TRADE ALERTS
STAGE CHART INVESTING
TOP 100 STOCKS
PREVIOUS GREEN LINE STOCKS