
By ATGL
Updated September 25, 2025
Market breadth analysis offers traders a deeper understanding of the underlying market strength beyond simple price movements. The McClellan Oscillator is one of the most respected technical indicators for measuring this breadth, offering traders a quantitative approach to assess market momentum and identify potential turning points. This oscillator transforms advance-decline data into actionable trading signals, helping professionals time entries and exits with greater precision.
What Is the McClellan Oscillator?
The McClellan Oscillator measures the difference between advancing and declining stocks using exponential moving averages, creating a momentum indicator that reflects market breadth rather than price action alone. Sherman and Marian McClellan developed this tool in 1968 upon recognizing that market strength depends on the participation of the broader stock universe.
This indicator identifies shifts in market sentiment before they become apparent in major indices, confirms existing trends through breadth participation, and highlights potential divergences that signal reversals. The oscillator operates on the principle that healthy bull markets require broad participation from individual stocks, while bear markets often begin with narrowing breadth despite continued strength in major indices.
McClellan Oscillator Calculation
The McClellan Oscillator calculation centers on the relationship between two exponential moving averages applied to daily net advances.
Net Advances = (Number of Advancing Stocks) – (Number of Declining Stocks)
The oscillator then subtracts the 39-day exponential moving average of net advances from the 19-day exponential moving average of net advances.
McClellan Oscillator = 19-day EMA(Net Advances) – 39-day EMA(Net Advances)
The 19-day period captures shorter-term breadth momentum, while the 39-day period represents longer-term breadth trends. When the shorter-term average exceeds the longer-term average, the oscillator produces positive values, indicating bullish breadth momentum. Negative values suggest that declining stocks outnumber advancing stocks on a momentum basis.
Key Signals and How To Interpret Them
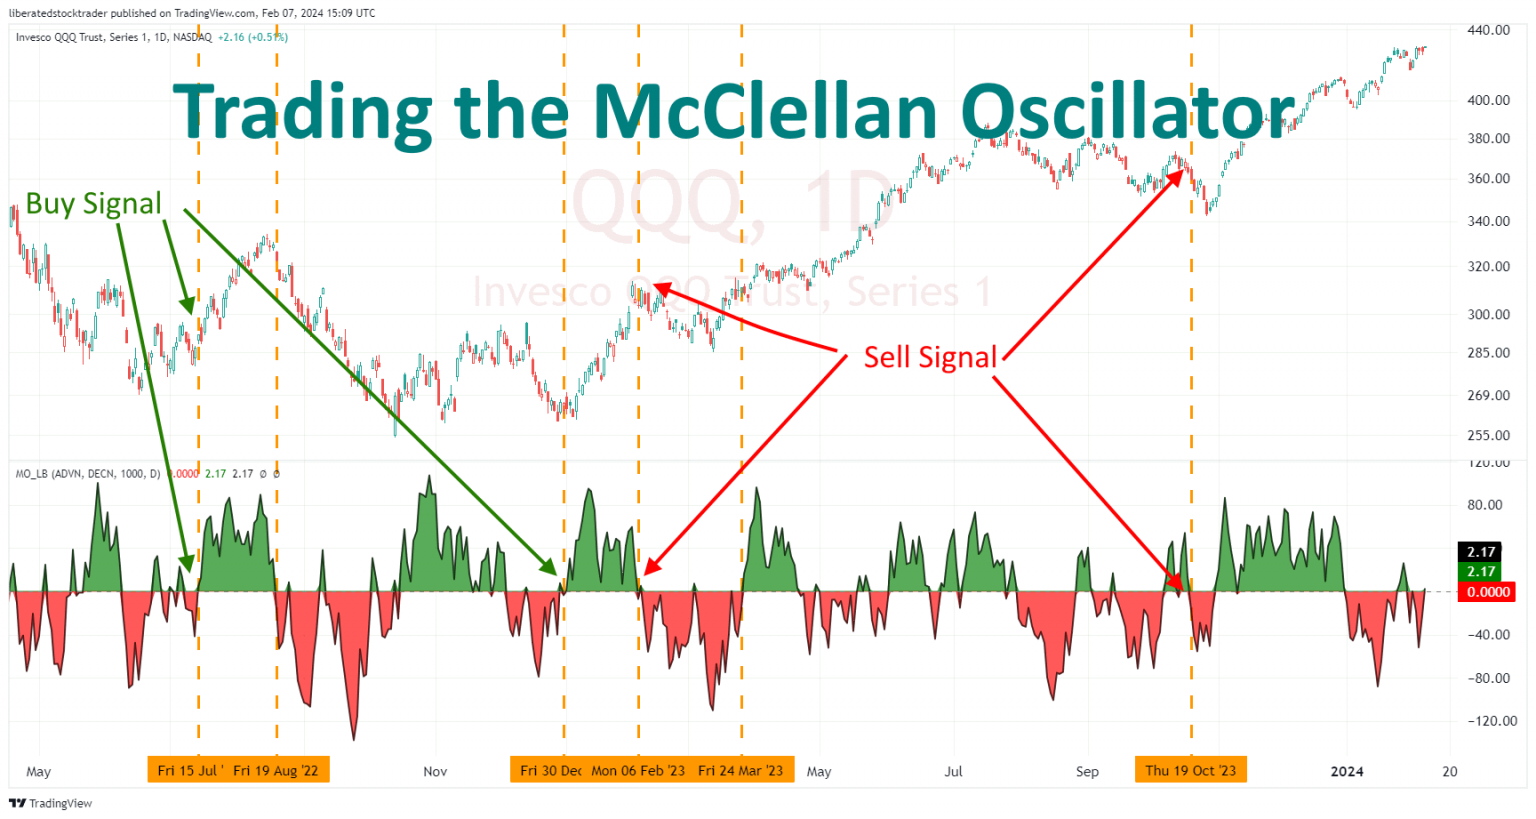
- Zero-Line Crossovers and Trend Confirmation: Zero-line crossovers represent the most fundamental McClellan Oscillator signals. When the oscillator moves above zero, it indicates that short-term breadth momentum has turned positive, often preceding or confirming upward price movement in major indices. Crossovers below zero signal deteriorating breadth conditions and potential downside pressure.
- Divergences Between Price and Breadth: Divergences occur when the oscillator moves in the opposite direction of major market indices, providing early warning signals for trend changes. Bearish divergences form when indices reach new highs while the oscillator fails to confirm, suggesting weakening internal market strength despite surface-level gains.
- Extreme Readings and Reversal Setups: Extreme oscillator readings above +100 or below -100 often signal overbought or oversold conditions that may lead to short-term reversals. These extremes indicate that advance-decline ratios have reached unsustainable levels, creating conditions for mean reversion.
Example: Bearish Divergence Before a Selloff
During a bull market rally, the S&P 500 continued to reach new highs while the McClellan Oscillator peaked earlier and began declining. This bearish divergence warned of weakening breadth participation, preceding a significant market correction by several weeks.
Practical Trading Applications
Swing traders leverage the McClellan Oscillator to time entries around breadth momentum shifts. When the oscillator crosses above zero after spending time in negative territory, it often signals that market breadth has turned favorable for swing positions. These traders frequently combine breadth signals with swing trading indicators to create comprehensive entry strategies.
Professional traders use the McClellan Oscillator as a filter for other trading signals rather than a standalone entry mechanism. A breakout trading strategy becomes more reliable when the oscillator confirms positive breadth momentum, reducing the likelihood of false breakouts in weak market conditions.
Example: Confirming a Breakout With Oscillator Strength
When a major index breaks through resistance levels while the McClellan Oscillator shows readings above +50, the combination suggests both technical and breadth-based support for continued upward movement.
The oscillator can be applied across different timeframes by adjusting the underlying advance-decline data. Weekly or monthly net advance calculations create longer-term versions suitable for position trading, while daily calculations serve short-term trading strategies.
Combining McClellan With Other Tools
The McClellan Oscillator complements price-based momentum indicators like MACD by providing breadth confirmation for price signals. When both indicators generate buy signals simultaneously, the convergence suggests that both price and breadth momentum align favorably for upward movement.
Advanced traders combine the McClellan Oscillator with volume-based breadth indicators or sector-specific advance-decline data to create multi-dimensional market analysis. Market breadth indicators work together to provide a comprehensive view of market health across different measurement criteria.
Example: Oscillator + RSI in Sideways Markets
During sideways market conditions, traders combine McClellan readings with RSI to identify short-term trading opportunities. When the oscillator moves toward extreme readings while RSI shows oversold conditions, the combination may signal short-term bounce opportunities.
The McClellan Oscillator differs from other breadth indicators in its specific focus on momentum rather than absolute levels. While indicators like the Advance-Decline Line track cumulative breadth, the McClellan Oscillator emphasizes the rate of change in breadth, making it more sensitive to short-term momentum shifts.
Limitations and When To Use Caution
The McClellan Oscillator can produce misleading signals during periods when breadth diverges significantly from overall market sentiment. During sector rotation phases, strong performance in a few large-cap stocks may drive indices higher while the majority of stocks decline, creating oscillator readings that contradict index performance. These conditions require traders to consider broader market insights rather than relying solely on breadth data.
The exponential moving average calculations create some lag during rapid market movements. During news-driven events, the oscillator may fail to capture immediate breadth implications, leading to delayed signals.
Example: False Signal in News-Driven Volatility
Following unexpected Federal Reserve announcements, markets often experience violent movements that don’t reflect underlying breadth conditions. The McClellan Oscillator may generate signals based on temporary advance-decline imbalances that quickly reverse, creating false trading signals.
Traders should avoid common mistakes, including overreliance on extreme readings without price confirmation, ignoring broader market context when interpreting signals, and failing to incorporate proper trading risk management principles when acting on oscillator signals.
Improve Your Trading Game With the McClellan Oscillator
The McClellan Oscillator provides traders with a sophisticated approach to market breadth analysis, transforming advance-decline data into actionable momentum signals. By understanding zero-line crossovers, divergences, and extreme readings, traders can identify market turning points and confirm trend strength with greater accuracy than price analysis alone provides.
Success with the McClellan Oscillator requires combining breadth signals with comprehensive market analysis, proper risk management, and realistic expectations about the indicator’s limitations. When integrated thoughtfully into a broader trading strategy, this oscillator becomes a valuable tool for timing entries and identifying market shifts.
Ready to incorporate advanced breadth analysis into your trading strategy? Above the Green Line offers comprehensive trading education and professional-grade analysis tools through our membership programs. Access expert market analysis, proven strategies, and the resources needed to elevate your trading performance with confidence.

Related Articles

Penny Stocks: How to Identify High-Probability Setups Using Rules-Based Investing

Margin Call Explained: What Triggers It and How to Avoid One

AMC Short Squeeze Explained: Timeline, Causes, and Trading Risks

Volatility Clustering in Financial Markets: Understand Why It Happens
