Above the Green Line -01
  • Market Insights
        • Commentary
          • Daily
          • Weekly
        • BUY / SELL SIGNALS
          • Trade Posts
          • Recent Trade Alerts
          • Recent Day Trades
        • BLOGROLL
          • Dividend Growth Blog
          • ETF Sector Blog
          • Dow Dogs
          • TPOW Blog
  • Strategies
        • SWING TRADING
          • Current Positions
          • Watchlists
          • Closed Positions
          • Candidates - TOP 100
          • Specialty Stocks
        • WEEKLY STOCK PICK
          • TPOW Charts
          • TPOW Performance
          • TPOW Strategy Guide
          • TPOW Performance Dashboard
          • Why Weekly Trading Works
        • DAY TRADING
          • Watch List
        • ATGL DASHBOARD
        • ETF STRATEGIES
          • ETF Sector Rotation
          • ETF Sector Portfolio
        • DIVIDEND GROWTH
          • Dividend Growth Portfolio
          • Dividend Calendar
        • DOGS OF THE DOW
          • Dogs of the Dow Portfolio
          • DOW 5 Portfolio
  • Markets
        • US MARKET
          • Commodities
          • Energy
          • Precious Metals
          • Volatility
        • GLOBAL MARKETS
          • Market Indices
          • Economic Calendar
          • FOREX Heat Map
          • FOREX Cross Rates
          • Crypto Currency Market
  • Investing
    • Discord Community
    • Dashboard
  • Resources
        • INVESTING GUIDES
          • Dividend Growth Guide
          • Investment Strategy Framework
          • ETF Investing Handbook
          • Stock Trading Handbook
        • ARTICLES
          • Dividend Growth Model Articles
          • ETF Articles
          • Investment Strategies Articles
          • Market and Economic Insights
          • Stock Trade Articles
          • Stock Reviews
        • TOOLS
          • Stock Scanners
          • Charting Software
          • Brokerage Firms
          • Stocks We Review
        • STOCK CHARTS
          • Key Components
          • Reading Charts
          • Drawing Stock Charts
          • Identifying Trends
  • About
    • Contact Us
    • How to Win
    • #1 At Stockcharts
    • Disclaimer
    • FAQ
  • Log In
  • Subscribe

February 5, 2018

Money Wave Alert! Feb 5, 2018

QQ Chart

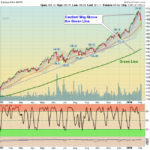
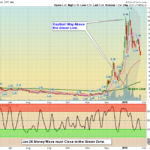
  Markets dumped more today after Tammy spent all of her Money last month Buying on the Good News. Smart Money Sold on the Good News and in the Red Zones last month, and is waiting for Buy Signals to get back in. The S&P 500 is back … [Read more...]

February 4, 2018

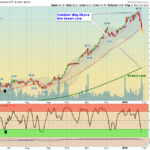
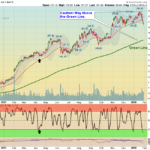
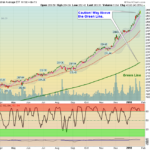
Green Line Weekly Feb 4, 2018

QQQ Chart

  02/04/2018:  Markets were down 3.5 - 4%  for the week, as most of the Earnings are out, and profit Taking came in on the "Good News". Most of the Indices are back down in the Green Zone, so the Markets should re-test the Highs soon if they … [Read more...]

February 2, 2018

Money Wave Alert! Feb 2, 2018

SPX Chart

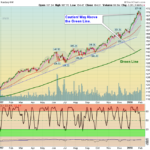
  Markets dumped down today after the Long Term Bond made 8 month Lows.  Lower Bond prices causes Interest Rates to rise. Most of the Indices are slowly returning to their Red Lines for a probable bounce. The S&P 500 is back down in the … [Read more...]

February 1, 2018

Money Wave Alert! Feb 1, 2018

  Markets were mixed today after "Gapping Down" on the opening. The S&P 500 is almost back down in the Green Zone, as pull-backs have been small.   The Watch List  above is growing as more Investments are correcting back down to their … [Read more...]

January 31, 2018

Money Wave Alert! Jan 31, 2018

BA Chart

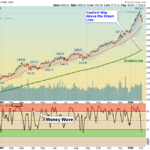
  Markets were mixed today after "Gapping Up" on the opening. The S&P 500 is not dumping much after Closing below the Pink Line of 2832 (10-day avg.).   The Watch List is growing as more Investments are correcting back down to their … [Read more...]

January 30, 2018

Money Wave Alert! Jan 30, 2018

ITB Chart

  Markets were down today as several Indices broke their Pink Lines (10-day avgs.) to create Short Term Sell Signals. The S&P 500 is still fighting it out at the Pink Line of 2831 (10-day avg.).   As the Markets pull-back, try to … [Read more...]

January 29, 2018

Money Wave Alert! Jan 29, 2018

AAPL Chart

  Markets were down slightly today, as Apple Inc. has put downward pressure on the DOW Index. When the Markets quit popping up from good Earnings, a pull-back will normally begin.  The S&P 500 has Support at the Pink Line of 2827 … [Read more...]

January 28, 2018

Green Line Weekly Jan 28, 2018

DIA Chart

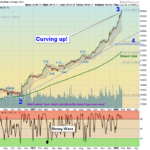
01/28/2018:  Markets were up another 2% for the week, as the "Melt Up" continued. Earnings have been better than expected on many companies to push the Markets higher. Bonds fell as the yield on the 10-year Treasury rise to 2.66%. This rise in … [Read more...]

January 26, 2018

Money Wave Alert! Jan 26, 2018

CANN Chart

  Markets were higher today, as mostly better Earnings continued to come out. When the Markets quit popping up from good Earnings, a pull-back will normally begin.  The S&P 500 has Support at the Pink Line of 2818 (10-day avg.).   Most … [Read more...]

January 25, 2018

Money Wave Alert! Jan 25, 2018

DIA Chart

  Markets were mixed again today, but a few DOW stocks are masking the weakness and selling. Many stocks are down today. When the Markets quit popping up from good Earnings, a pull-back will normally begin.  The S&P 500 has Support at … [Read more...]

  • « Previous Page
  • 1
  • …
  • 504
  • 505
  • 506
  • 507
  • 508
  • …
  • 559
  • Next Page »

Subscribe to Our Newsletter

AGL Logo

Get our eBook Now!

Candlestick - A Swing Traders Friend

We don’t spam! Read our privacy policy for more info.

You’ve been successfully subscribed to our newsletter!

Voted #1 at Stock Charts

SH Chart
Inverse S&P 500 Fund (SH) will have a Money Wave Buy today.

Help Us Help Animals

Help Us Help Animals

Recent Comments

  • ATGL Weekly Money Flow - 2026-02-08 on ATGL Top Pick of the Week! Jan 25, 2026
  • ATGL Weekly Money Flow - 2026-01-25 on ATGL Top Pick of the Week! Jan 11, 2026
  • ATGL Weekly Money Flow - 2025-12-28 on ATGL Top Pick of the Week Dec 21, 2025
  • Inside Bar Trading Strategy: Improve Timing and Wins on Price Action Trading: Mastering the Art of Reading the Market Without Indicators
  • Breakaway Gap Explained: Identify High-Probability Setups on Identifying Market Exhaustion Signals for Smarter Trading Decisions

Become a Green Liner!

Help me make more Money in the Stock Market.

ON ATGL

  • DashBoard
  • Weekly Commentary
  • Daily Buy / Sell Signals
  • Day Trade Setup
  • Trading Rooms

Design & Develop By Pixelvect

STRATEGIES

  • Swing Trading
  • ATGL Pick of the Week
  • Dividend Growth
  • ETF Sector Rotation
  • Dogs of the Dow

HELP

  • ATGL Trading Rules
  • FAQ
  • Account Maintenance
  • Contact US
  • Join

FOLLOW US

Instagram Linkedin Twitter Facebook

© COPYRIGHT 2024 · ABOVETHEGREENLINE.COM · ALL RIGHTS RESERVED · PRIVACY · TERMS · CONTACT · WATCHLIST · CURRENT