By Andrew Stowers
Updated June 30, 2026
IAU — the iShares Gold Trust — is one of the most straightforward ETFs available: it holds physical gold and tracks the gold price. But two aspects of IAU ownership that most investors overlook matter considerably more than the expense ratio.
First: gold ETFs are classified as collectibles under the U.S. tax code, subject to a maximum long-term capital gains rate of 28% — not the 20% maximum that applies to stocks. Second: gold’s most valuable recent portfolio contribution was not the typical safe haven scenario, but 2022 — when both stocks and bonds fell simultaneously and gold was approximately flat.
This review covers the complete IAU picture: structure, portfolio role, honest performance context, the tax treatment you need to know, and how to size gold exposure appropriately. We also have an ETF Investing Guide that covers many of the foundational concepts broached in this article that we highly recommend you review.
What Is IAU? The iShares Gold Trust Structure
| Quick Answer
IAU (iShares Gold Trust) is a physically-backed gold ETF managed by BlackRock/iShares. Each share represents approximately 1/100th of an ounce of physical gold stored in vaults managed by JPMorgan Chase. When gold prices move, IAU shares move proportionally — the most direct, liquid, and accessible way for retail investors to own gold without taking physical delivery. |
IAU is a grantor trust, not a registered investment company. The trust holds physical gold bars in allocated form — specific bars attributed to the trust — held in vault facilities managed by JPMorgan Chase, primarily in London. The gold is audited annually by an independent auditor and is held separately from the custodian’s own assets.
The Fractional Ounce Structure
Each IAU share represents approximately 1/100th of a troy ounce of gold. When gold is trading at $2,000 per ounce, IAU shares trade at approximately $20 each. This low per-share price makes IAU highly accessible for small investors and allows precise dollar-amount allocation. By comparison, GLD shares represent approximately 1/10th of an ounce (priced around $185 when gold is at $2,000) — the same gold exposure but at a higher per-share cost that is less granular for small positions.
The Expense Ratio Accrual
IAU’s approximately 0.25% annual expense ratio does not appear as a line-item charge — instead, it is reflected in a slight divergence between IAU’s price and the spot price of gold over time. Each day, a tiny fraction of gold backing per share is deducted. After 10 years, each IAU share represents fractionally less gold than it did at inception — this is the expense ratio at work, not a structural flaw.
Who Cannot Redeem for Physical Gold
Retail investors cannot exchange IAU shares directly for physical gold bars. Only large institutional ‘authorized participants’ (broker-dealers and institutional market makers) can create or redeem IAU shares for physical gold. Retail investors buy and sell IAU shares on the NYSE Arca exchange at market prices throughout the trading day.
Why Investors Hold Gold: The Four Investment Rationales
1. Inflation Hedge
Gold’s inflation hedge track record is strongest over very long periods — decades, not years. Over a 50-year horizon, gold has roughly maintained real purchasing power against consumer price inflation. In the short term, gold’s correlation with annual inflation is weak and inconsistent — gold fell in some high-inflation years and rose in some low-inflation years. The inflation hedging case is most compelling as a multi-decade portfolio insurance position, not a year-to-year inflation trade.
2. Currency Debasement Protection
Gold’s strongest short-to-medium-term price relationship is with real interest rates: when nominal interest rates minus inflation (real rates) are negative or falling, gold tends to appreciate because the opportunity cost of holding non-yielding gold decreases. When real rates are high and rising, gold faces strong competition from yield-bearing assets. The 2020-2021 gold surge coincided with near-zero nominal rates and rising inflation — deeply negative real rates. The 2022 gold headwind coincided with the Fed raising rates aggressively toward inflation.
3. Portfolio Diversification
Gold’s correlation with U.S. equities has historically been near zero to slightly negative. Its correlation with U.S. Treasury bonds is also low. Adding gold to a portfolio of equities and bonds reduces overall portfolio volatility without proportionally reducing expected return — the definition of a genuine diversification benefit. This low-correlation property is gold’s most analytically defensible long-run investment case.
4. Safe Haven and Crisis Demand
During geopolitical tension, financial system stress, and currency crises, investors buy gold — central banks, sovereign wealth funds, and retail investors globally treat gold as the ultimate store of value outside the banking system. Central banks have been net gold buyers for over a decade. This structural institutional demand provides a floor under gold prices over time.
IAU vs Alternatives: GLD, Physical Gold, SGOL, and GDX
| Note on GLD vs IAU
ATGL has a dedicated GLD vs IAU comparison article that covers the head-to-head details. This section provides the full vehicle comparison including alternatives beyond GLD. |
Gold exposure is available through several vehicles, each with distinct trade-offs:
| Vehicle | Structure | Approx. Cost | Liquidity | Tax Treatment | Best For |
|---|---|---|---|---|---|
| IAU | Physical gold trust | ~0.25% ER | Very high | 28% collectibles rate | Buy-and-hold; low cost |
| GLD | Physical gold trust | ~0.40% ER | Highest | 28% collectibles rate | Active traders; deep options |
| Physical gold | Direct ownership | Dealer markup + storage | Low (must find buyer) | 28% collectibles rate | Crisis hedge; no counterparty risk |
| SGOL | Physical gold trust | ~0.17% ER | Moderate | 28% collectibles rate | Swiss vault; lowest cost |
| GDX | Gold miners equity ETF | ~0.51% ER | High | 20% (equity, not collectible) | Leveraged gold exposure; better tax |
IAU vs GLD: The Key Differences
IAU and GLD provide essentially identical gold exposure — both are physically backed trusts. The meaningful differences: IAU charges approximately 0.25% ER vs GLD’s 0.40% — a 0.15% annual cost advantage that compounds meaningfully over 10-20 years. GLD has slightly higher per-share price (1/10th oz vs IAU’s 1/100th), which makes GLD more natural for options trading where contract sizes are based on share price. QQQ-like active traders and options users prefer GLD; buy-and-hold investors prefer IAU’s lower cost.
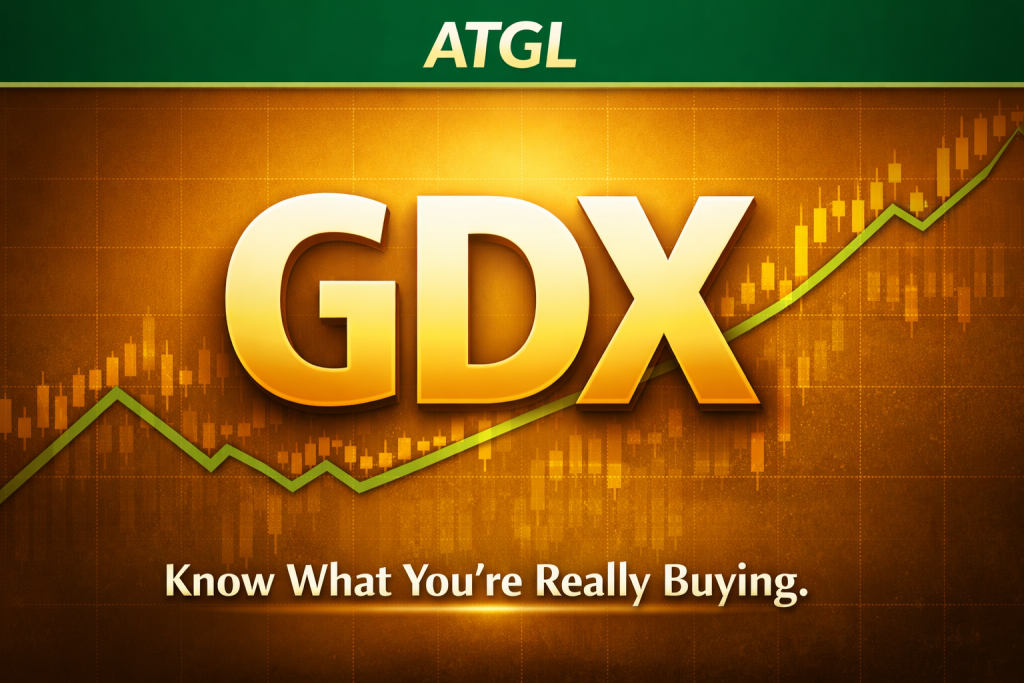
GDX: The Tax-Advantaged Gold Alternative
GDX (VanEck Gold Miners ETF) holds gold mining company stocks — not physical gold. This equity classification means long-term GDX gains are taxed at the standard 20% maximum, not IAU’s 28% collectibles rate. GDX also provides leveraged gold price exposure — historically amplifying gold price moves approximately 2-3x in both directions, with additional equity-specific risks from individual mining company operations. For investors comfortable with higher volatility and seeking to avoid the collectibles rate, GDX in the satellite is a tax-efficient alternative to IAU.
The Critical Tax Treatment: Gold ETFs and the 28% Collectibles Rate
| This Is the Section Most IAU Investors Wish They Had Read First
Gold ETFs — including IAU and GLD — are classified as investments in a ‘collectible’ under the U.S. tax code. Long-term capital gains from gold ETFs are taxed at a MAXIMUM rate of 28%, not the 20% maximum that applies to equity ETFs. For investors in the 37% ordinary income bracket, this difference costs real money. |
Why Gold ETFs Are Collectibles
The IRS classifies gold, silver, coins, and similar tangible assets as collectibles. ETFs that hold physical gold are treated as if the investor held the gold directly — making the shares collectibles for tax purposes. The maximum long-term capital gains rate for collectibles is 28% (set by Congress in the Taxpayer Relief Act of 1997), compared to 20% for stocks held more than one year (for investors in the top income bracket).
The Tax Impact in Dollars
For an investor in the 37% ordinary income bracket: equity ETF long-term gains are taxed at 20%; IAU long-term gains are taxed at 28%. On a $50,000 gain from IAU, the tax is $14,000 rather than $10,000 — a $4,000 difference from the rate alone. Over a decade with a meaningful gold allocation, the cumulative tax difference is substantial.
The Account Location Solution
Holding IAU in a Roth IRA eliminates the collectibles rate disadvantage entirely — all gains compound tax-free and are withdrawn tax-free. A traditional IRA defers the tax until withdrawal, when distributions are taxed as ordinary income regardless of the collectibles classification. In a taxable account, the 28% collectibles rate applies at realization.
Priority: IAU → Roth IRA first. If Roth IRA space is limited, traditional IRA second. Taxable account last. If only a taxable account is available, the after-tax return on IAU should be calculated using the 28% rate, not the standard equity rate.
Short-Term Holds: The Distinction
Gold ETF gains held under one year are taxed as short-term capital gains — ordinary income rates — regardless of whether they are collectibles. The 28% collectibles rate only applies to long-term (12+ month) holdings. Active traders who never hold IAU long-term are not affected by the collectibles rate distinction.
How Gold Performs Across Market Environments
Environments Where Gold Thrives
- Negative or falling real interest rates: the opportunity cost of non-yielding gold decreases; gold is relatively more attractive vs bonds
- Weakening U.S. dollar: gold is priced in dollars globally; a falling dollar means gold is cheaper for foreign buyers, supporting demand and price
- Financial system stress: banking crises, currency crises, sovereign debt concerns drive institutional and retail safe haven buying
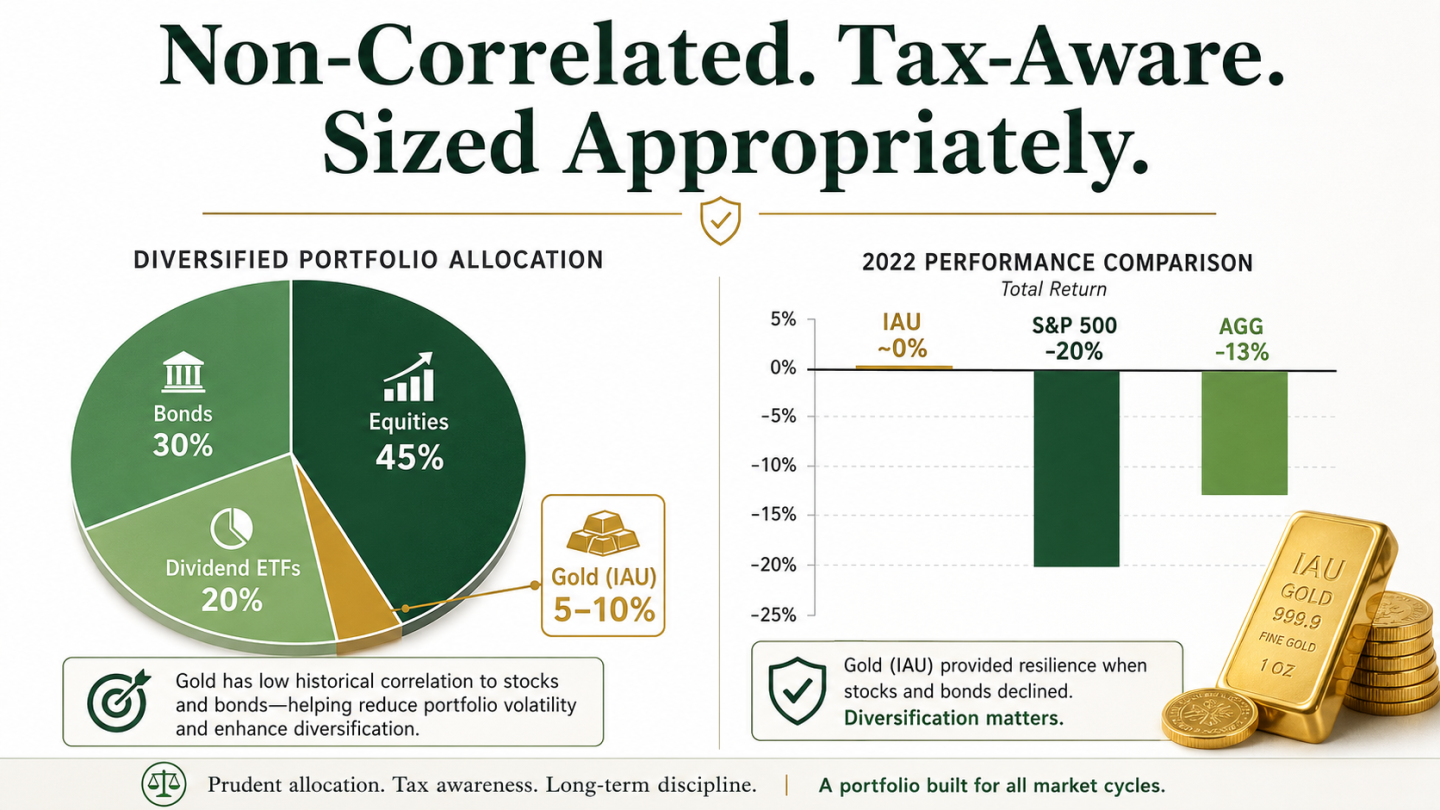
- 2022: both stocks (-20%) and bonds (-13%) declined simultaneously; gold was approximately flat — the clearest recent demonstration of gold’s diversification value
Environments Where Gold Struggles
- Rising real interest rates: high positive real rates make yield-bearing assets more attractive vs non-yielding gold
- Strong U.S. dollar: reduces gold demand from non-dollar buyers
- Deflationary conditions with stable rates: gold’s inflation narrative is less compelling
The Honest Long-Run Return Picture
Gold’s long-run real return is approximately zero — it maintains purchasing power over very long periods but does not grow it. Equities compound wealth; gold preserves it. Over any 20-year period in modern financial history, a portfolio heavily weighted toward equities has substantially outperformed one heavily weighted toward gold on total return. Gold’s investment case is diversification and insurance, not return generation.
The 2022 proof point: the specific environment where gold delivered its most valuable contribution was the year when everything else failed simultaneously. An investor without gold in 2022 had no non-correlated asset to buffer both the equity and bond declines.
How Much Gold Belongs in a Portfolio?
Portfolio optimization research and practitioner guidance consistently converge on a similar range:
| The 5-10% Gold Allocation
Large enough to provide meaningful diversification benefit during equity and bond market stress. Small enough that gold’s long-run return underperformance vs equities does not significantly drag total portfolio returns. The World Gold Council and academic portfolio research generally find that 5-10% gold improves portfolio risk-adjusted returns (Sharpe ratio) compared to portfolios without gold. |
Why Not More
Above 10-15%, gold’s long-run return underperformance vs equities becomes a meaningful drag. Gold has no earnings, no cash flows, no compounding business fundamentals. It is a diversifier, not a return engine. Allocating 25-30% to gold in an attempt to maximize bear market protection typically costs significant long-run return versus a lower-gold portfolio.
Account Location Priority
Roth IRA: optimal — tax-free growth and tax-free withdrawal, eliminating the 28% collectibles rate permanently. Traditional IRA: good — defers tax, but ordinary income rate at withdrawal. Taxable account: acceptable but the 28% collectibles rate must be factored into after-tax return expectations.
Implementation
A 7% IAU position in a portfolio holding VUG (growth equity), SCHD (dividend equity), AGG (bonds), and IAU (gold) provides four non-correlated risk/return regimes covering growth, income, rate sensitivity, and inflation. Rebalance annually back to target — gold is volatile and will drift significantly from target allocation over 12-month periods.
IAU in the ATGL Core/Satellite Framework
In ATGL’s core/satellite portfolio approach, IAU fits as a permanent non-correlated satellite allocation — not a market-timing trade.
IAU as a Permanent Satellite Holding
A 5-10% IAU position maintained through bull and bear markets earns its allocation through diversification benefit rather than directional performance. In the years when equities and bonds both perform well, gold often lags — but it is not failing, it is providing insurance that costs a small premium when not needed. The value is most visible in years like 2022 when both primary asset classes disappoint simultaneously.
When to Increase the Allocation
Several macro signals justify increasing gold from 5% toward 8-10%: rising inflation expectations, central bank monetary expansion beyond economic growth (quantitative easing), weakening dollar trends, geopolitical escalation, or portfolio over-concentration in equity risk. These are not timing signals but thesis signals — when the underlying case for gold strengthens, the allocation can be modestly increased within the satellite budget.
GDX as the Leveraged Alternative
For investors comfortable with higher volatility and seeking a better tax treatment: GDX provides leveraged gold exposure with equity-rate capital gains (20% maximum vs IAU’s 28%). GDX historically moves approximately 2-3x the gold price in both directions, adding volatility but also additional return potential in gold bull markets. A combination of IAU (physical, lower volatility, full gold correlation) and GDX (mining companies, higher volatility, leveraged gold exposure) within the satellite captures both forms of gold market participation.
IAU: The Complete Picture
IAU provides physical gold exposure through one of the largest, most liquid gold ETFs available — at a competitive 0.25% expense ratio and with a per-share price that makes precise allocation accessible for all account sizes.
The complete framework:
- Structure: physically backed by gold in JPMorgan Chase vaults; audited annually; 1/100th oz per share
- Expense ratio: approximately 0.25% — lower than GLD; verify at iShares before investing
- The four rationales: inflation hedge (long-run), currency debasement protection, portfolio diversification, safe haven demand
- The 28% collectibles rate: gold ETF long-term gains taxed at 28% maximum, not 20% — hold in Roth IRA to eliminate this
- GDX tax advantage: mining stocks are equity, not collectibles — taxed at 20% maximum
- 2022 proof point: approximately flat when S&P 500 -20% and AGG -13% — gold’s diversification value most visible when both traditional asset classes fail
- Portfolio sizing: 5-10% as the diversification-to-drag optimum
- Not a return generator: gold maintains purchasing power over very long periods; equities grow it; choose deliberately
| Build a Complete Diversified Portfolio With ATGL
At AboveTheGreenLine.com we give investors the complete analytical framework for every asset class — from equity ETFs and bond portfolios to alternative diversifiers like gold — and the rules-based strategies that actively manage each component. Join us Above the Green Line. |
Frequently Asked Questions
What does IAU ETF invest in?
IAU (iShares Gold Trust) holds physical gold bullion stored in vaults managed by JPMorgan Chase, primarily in London. Each IAU share represents approximately 1/100th of a troy ounce of gold. The ETF tracks the spot price of gold with minimal tracking error — when gold rises 5%, IAU shares rise approximately 5% minus the daily accrual of the ~0.25% annual expense ratio. The gold is audited, insured, and held in allocated form separate from the custodian’s own assets.
What is the expense ratio of IAU?
IAU’s expense ratio is approximately 0.25% annually — one of the lower-cost physically-backed gold ETFs available. This compares to GLD at approximately 0.40% and SGOL at approximately 0.17%. The expense ratio is reflected in a slight divergence between IAU’s price and the spot gold price over time as the gold backing per share decreases slightly each day. Verify the current expense ratio at iShares’ fund page as this may change.
Is gold a good investment during a recession?
Gold’s performance during recessions is mixed. In the 2008-2009 financial crisis, gold fell initially in the liquidity selloff then surged. In 2022 — which was not a traditional recession but an inflation-driven bear market — gold was approximately flat while both stocks fell 20% and bonds fell 13%, providing gold’s most valuable recent diversification. Gold’s consistent long-run case is as a diversifier and store of value, not a guaranteed recession safe haven.
What is the minimum investment for IAU?
IAU has no minimum beyond the cost of one share. IAU shares are priced at approximately 1/100th of the gold spot price — when gold is at $2,000 per ounce, IAU trades at approximately $20 per share. This low per-share price makes IAU highly accessible for small investors and allows precise percentage-of-portfolio allocation without large minimum commitments.

Related Articles
[pt_view id=”fb2451fm3r”]